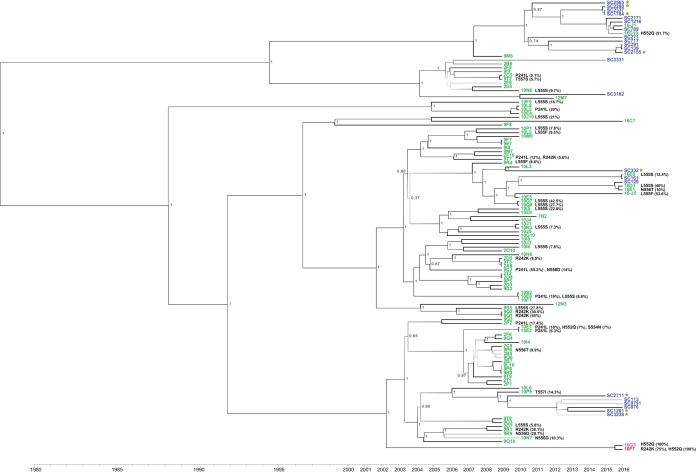
FIG 3 .
Whole-genome sequencing of 95 HPIV-3 primary viral isolates and 23 HPIV-3-positive clinical samples from excess samples at the University of Washington Virology Laboratory. All specimens were collected from 2009 to 2016. Clinical “SC” HPIV-3 genomes shown in blue were sequenced metagenomically directly from patient samples, while viral isolates are shown in green. HPIV-3 sequences from clinical samples from the original matched sample are shown as brown stars. At the bottom, 16F7 is shown in red, as it is a likely culture-adapted College of American Pathologists proficiency testing sample, and 16G3 is pink because it was isolated over a 14-day period at the same time 16F7 was being cultured and is a potential 16F7 contaminant. Posterior support values are shown next to branches with gray scale gradient shading from black at 0.7 to very light gray at 0. The scale at the bottom of the figure shows the collection date for each sample.

