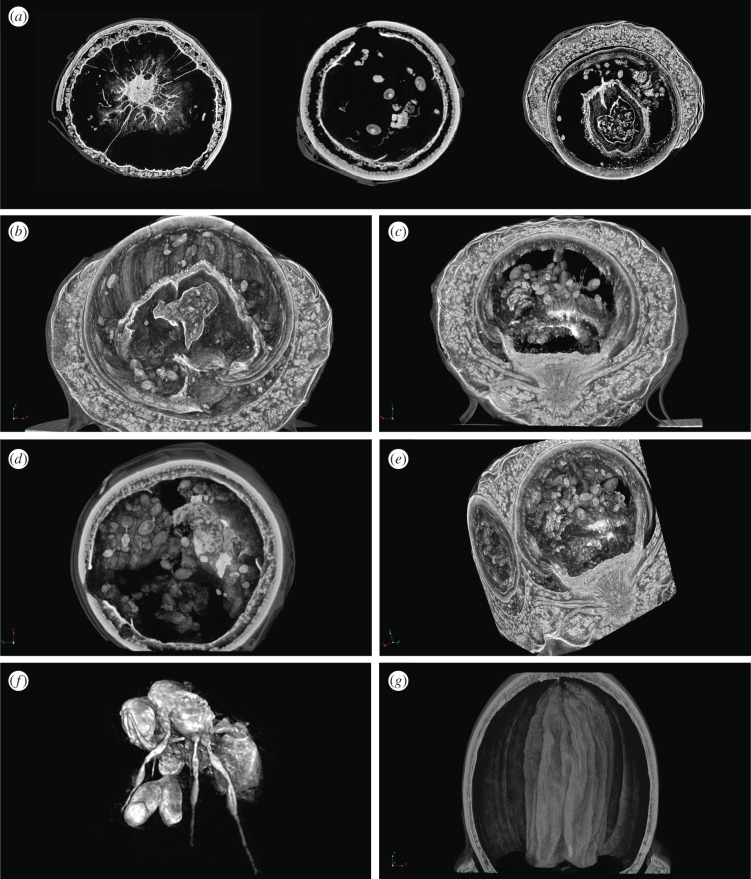
Figure 2.
Visualizing acorn ant colonies with X-ray microtomography. In the first panel (a), three virtual cross-sections through acorns are shown, with lighter shades of grey associated with higher density plant and animal tissues. The centre image shows a cross section including a worker positioned near the nest entrance. The first and third images show a toroidal shape nest cavity surrounding seed tissue in the centre. Three-dimensional renderings of regions of interest within the scanned acorns are displayed in (b–e), illustrating the density of ants and the complexity of the cavity space within these nests. (f) A rendering from within one acorn's dataset showing a queen T. curvispinosus standing over a pile of her larvae. (g) A rendering of a relatively freshly fallen acorn that had not yet been parasitized or occupied by insects. (Online version in colour.)

