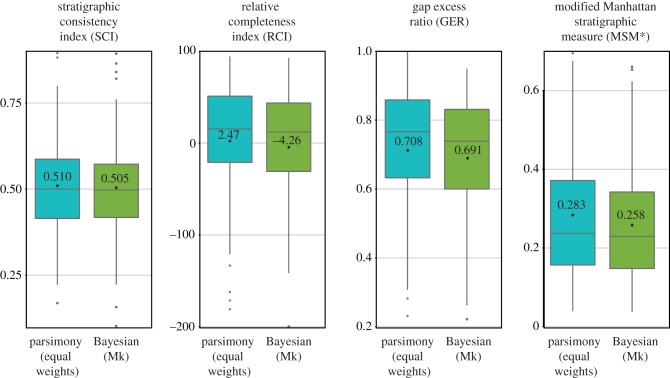
Figure 1.
Distribution of average stratigraphic measures of trees from 167 datasets (either most parsimonious trees with or trees sampled from the posterior distribution of Bayesian searches). Box plots show median, upper and lower quartiles and outliers, while black spots and text values are averages for all datasets. (Online version in colour.)

