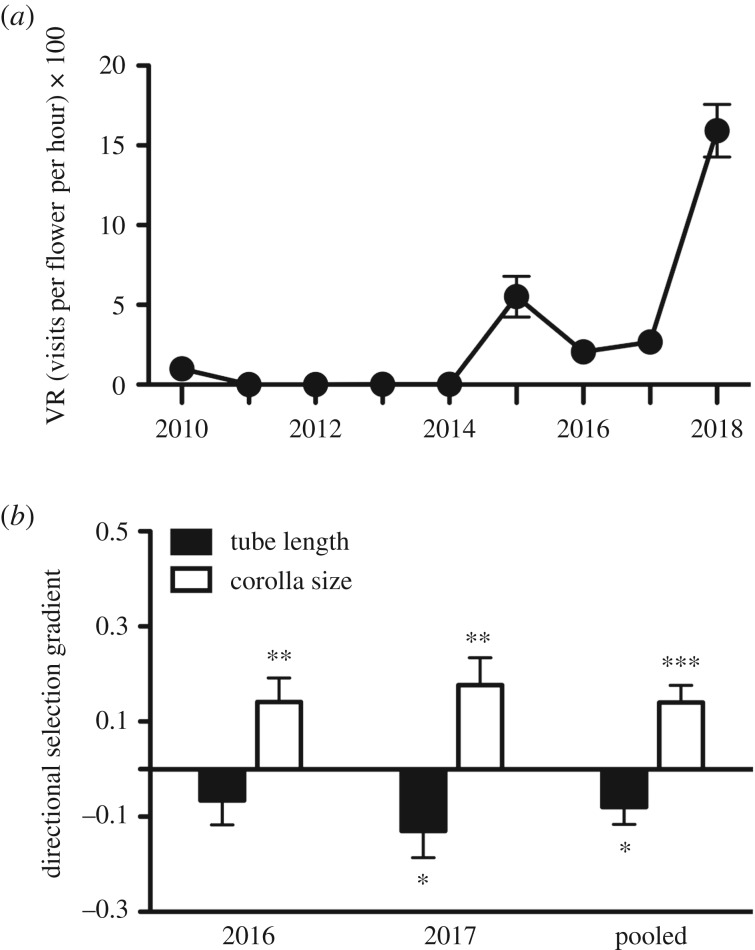
Figure 2.
(a) Pattern of temporal change in the mean (s.e.) visitation rate of Bombus terrestris during 9 consecutive years. Data from 2010 to 2012 were obtained from [13], and those from 2013 to 2018 are unpublished from a long-term research in the study site. (b) Directional selection β-coefficients (s.e.) for tube length and corolla size in 2016, 2017 and in the 2-year pooled analysis. *p < 0.05, **p < 0.01.

