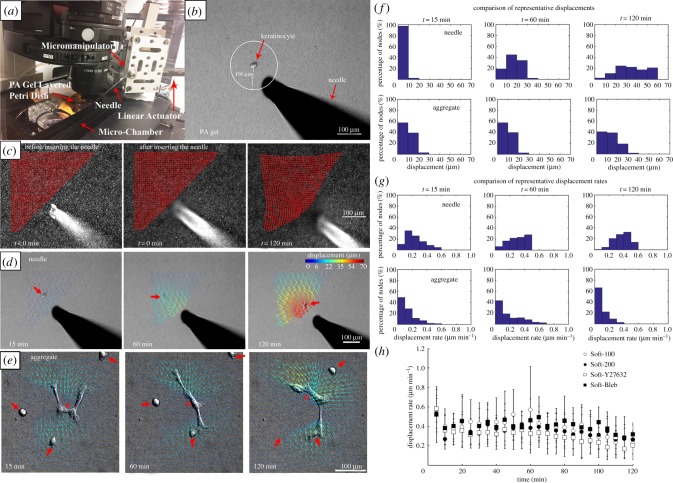
Figure 1.
Experimental set-up to apply controlled mechanical deformations to PA gels. (a) The PA gel is placed within a microscope-mounted micro-chamber contained with an environmentally controlled enclosure. A servo-controlled liner actuator drives needle movement via a high-precision micromanipulator. (b) A single keratinocyte is identified and the needle is inserted a prescribed distance away from the centroid of the cell, in this instance approximately 100 µm. (c) Substrate deformation in response to needle movement are calculated by tracking the movement of embedded fluorescent microspheres at each node (red points) of a user-defined grid superimposed on the image. (d) A displacement field can be calculated from the nodal displacements. Here, the series of images depicts the evolution of substrate displacement vectors, where the arrows indicate direction and the displacement magnitudes are colour-coded. Large red arrows denote the position of the migrating cell. Note that although the needle moves at the prescribed rate of 1 µm min−1, the rate of gel displacement decreases with distance from the needle. (e) Displacement fields for a prototypical evolving multicellular aggregate (*) at equivalent time points. The three single cells denoted with large red arrows eventually join the aggregate (adapted from [42]). (f) Histograms showing the corresponding substrate displacements displayed in (d,e). (g) Histograms showing the corresponding substrate displacement rates corresponding to (d,e). (h) Comparison of the substrate displacement rates in the PA gel initially located approximately 100 µm from the microneedle tip. (Online version in colour.)

