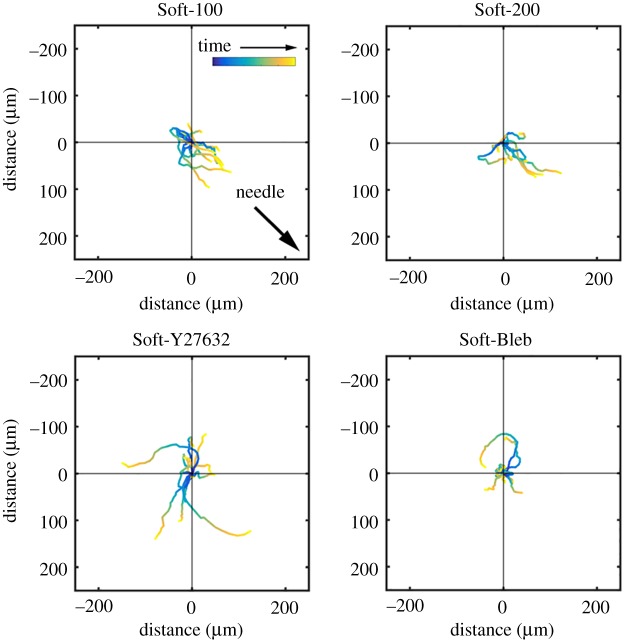
Figure 3.
Adjusted cell motility on PA gels. Each colour line shows the trace of  , the position vector of the cell due to cell migration effects alone (see equation (2.2)). Each cell path is colour-coded to show the relative time along the path from its beginning at the origin (dark blue) to the final tracked position (yellow). The majority of cells moved toward the displacing needle for needles nominally positioned either 100 or 200 µm from the cell centroid at the start of the experiment (i.e. Soft-100 and Soft-200, respectively). Exposure to the Rho kinase inhibitor Y27632 or the actin–myosin inhibitor blebbistatin interrupted this directed migration. (Online version in colour.)

