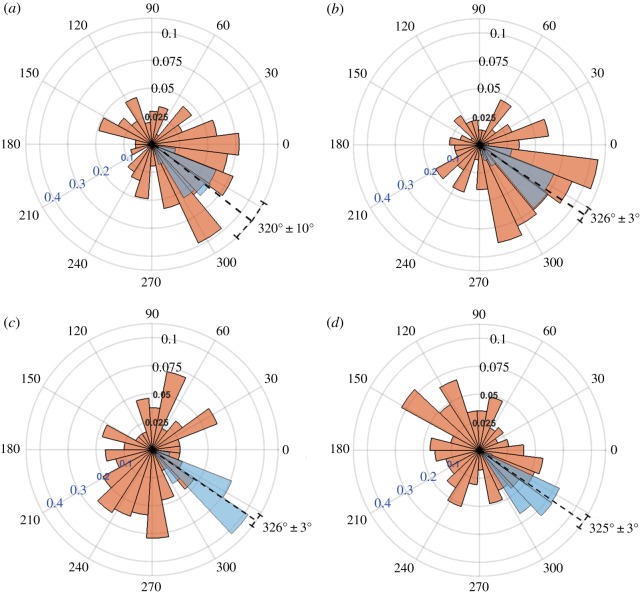
Figure 4.
Polar histograms showing the combined angle distributions in degrees of adjusted cell displacement  (red) and substrate displacement
  (blue) for all 10 replicates of the (a) Soft-100, (b) Soft-200, (c) Soft-Y27632 and (d) Soft-Bleb experiments. Each distribution is normalized by the total number of observations with the black radial text associated with
  and the blue radial text associated with
  . The dashed line shows the mean and standard deviation of the angle of needle movement. For all four conditions, the displacements of the substrate aligned with the direction of needle movement. In addition, for Soft-100 and Soft-200, V-tests indicate that the direction of cell movement is coincident with that of the needle-induced substrate deformations, but not for soft-Y27632 or Soft-Bleb (p < 0.001). (Online version in colour.)

