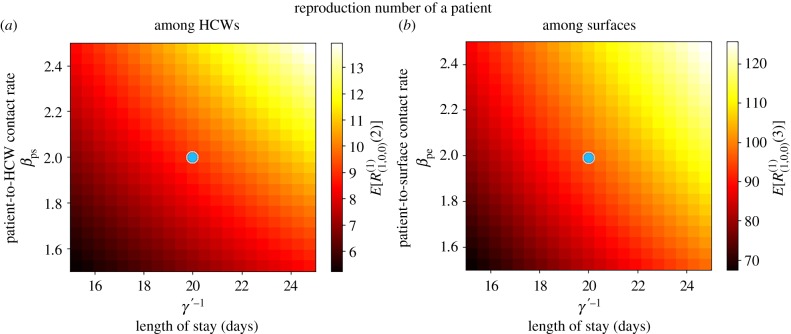
Figure 8.
Mean reproduction number of a colonized patient among HCWs (E[R(1)(1,0,0)(2)], a) and among surfaces (E[R(1)(1,0,0)(3)], b), versus γ′−1, βps and βpe. Blue dot corresponds to parameter values (βps, βpe, γ′−1) = (2.0, 2.0, 20.0) in electronic supplementary material, Table S3, leading to values E[R(1)(1,0,0)(2)] = 9.09 and E[R(1)(1,0,0)(3)] = 96.83. Case study 3.

