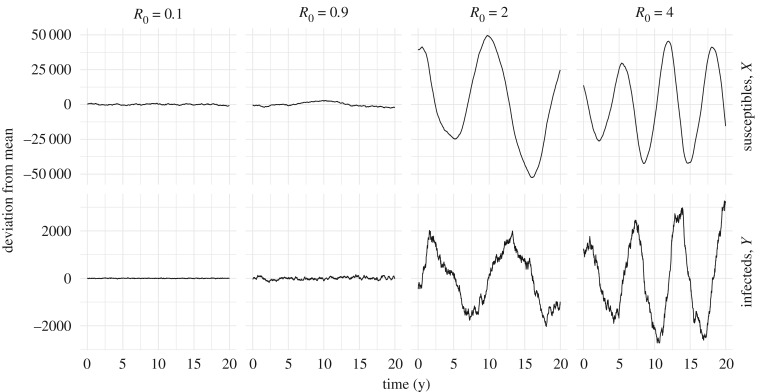
Figure 1.
Example of simulated time series that could provide a distance estimate. Deviations are plotted instead of the simulated counts to align the time series vertically and because the deviations are what is used to calculate the estimate. The main idea is to estimate the rate at which deviations decay and oscillate. As these examples suggest, these rates tend to increase as the parameters of the system move away from R0 = 1. Parameters for the simulations are in table 1, with β set to R0(γ + μ).

