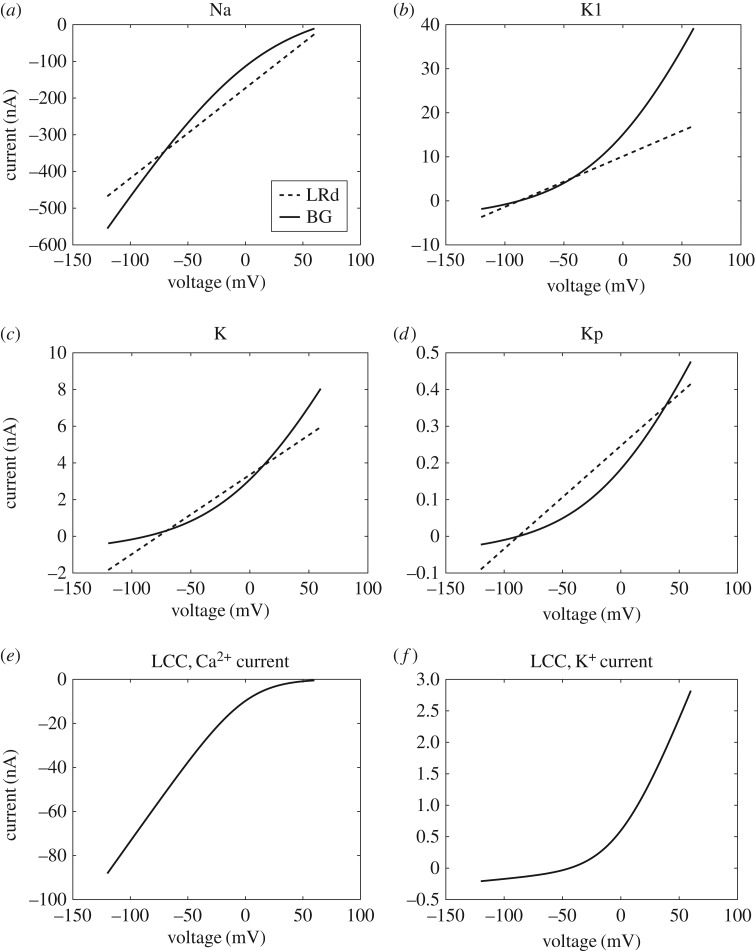
Figure 4.
Comparison of I-V curves between the Luo–Rudy (LRd) and bond graph (BG) models. (a) INa, (b) IK1, (c) IK, (d) IKp, (e) ICa,L, (f) IK,L. The standard concentrations in Luo & Rudy [1] ([Na+i] = 10 mM, [Na+e] = 140 mM, [K+i] = 145 mM, [K+e] = 5.4 mM, [Ca+i] = 0.12 μM, [Ca+e] = 1.8 mM) were used to match I-V curves.

