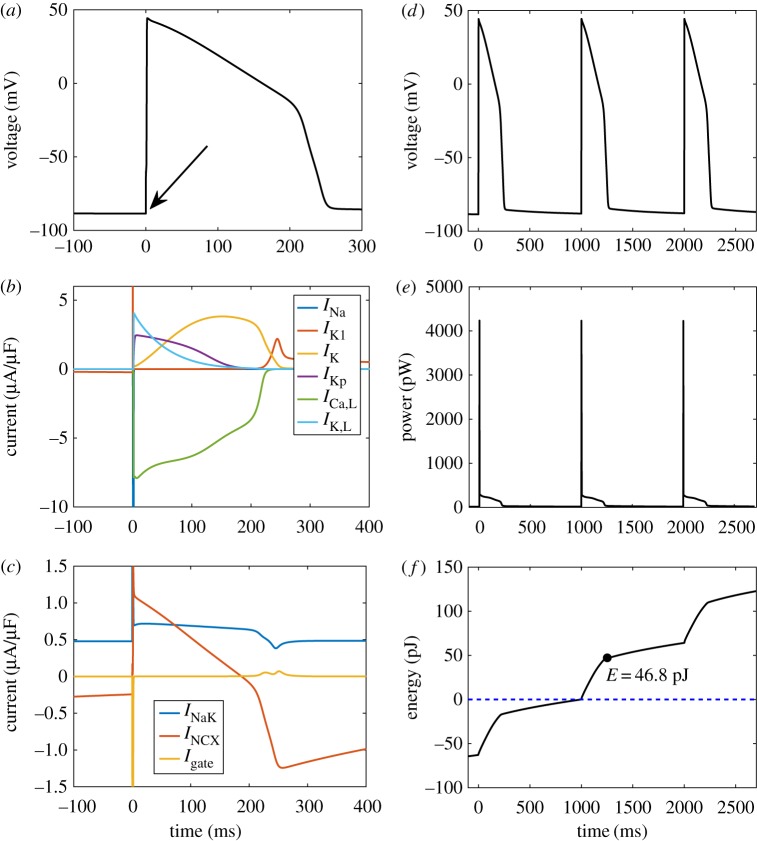
Figure 7.
A simulation of the cardiac action potential using a bond graph model. (a) Membrane voltage, following stimulation with a conservative stimulus current (arrow); (b) ion channel currents; (c) transporter and gating currents; (d) membrane voltage over three cycles, for comparison with (e) and (f); (e) power consumption; (f) energy dissipated, with the variable E representing the energy consumption over the duration of the action potential. The model was run initially for 300 ms to allow the membrane potential and channel gates to stabilize. The intracellular ion concentrations were dynamic variables with initial concentrations [Na+i] = 10 mM, [K+i] = 145 mM and [Ca+i] = 0.12 μM. Constant concentrations were [Na+e] = 140 mM, [K+e] = 5.4 mM, [Ca+e] = 1.8 mM, [MgATP] = 6.95 mM, [MgADP] = 0.035 mM, [Pi] = 0.3971 mM and pH = 7.095. T = 310 K. (Online version in colour.)

