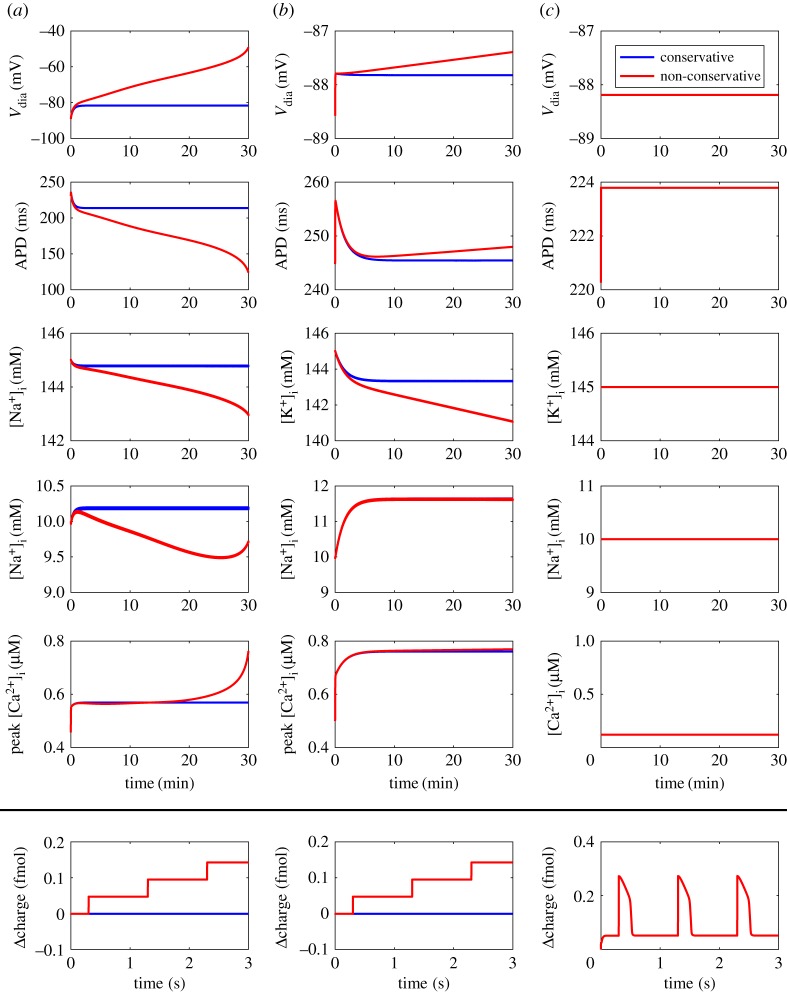
Figure 8.
Effect of stimulus type and variable ion concentrations on drift in the bond graph model. (a) Dynamic ion concentrations; (b) Dynamic intracellular ion concentrations; (c) Constant ion concentrations. Results are shown for stimuli that conserve overall charge (blue) and those that do not conserve charge (red). Non-conservative stimulus currents contain non-specific charge, and conservative stimulus currents contain charge and potassium ions. Charge values are given as differences from the initial value of . . Definitions: , diastolic membrane potential; APD, action potential duration at 90% repolarization. (Online version in colour.)

