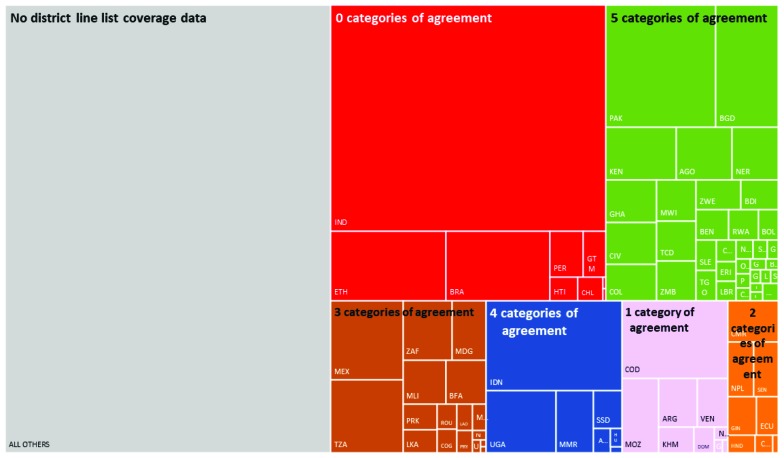
Figure 1.
Tree mapping for 96 countries and the agreement observed between comparisons of reported aggregated district counts and a re-categorization of district line lists of coverage. Note: Shaded areas in the tree map are proportional to each country’s 2016 estimated global birth cohort. Countries are indicated on the tree map according to their ISO-3 code (available online at United Nations Trade Statistics Knowledgebase, https://unstats.un.org/unsd/tradekb/knowledgebase/country-code). A listing of countries included in the tree map by category of agreement is available in Appendix S1 in Online Supplementary Document(Online Supplementary Document).

