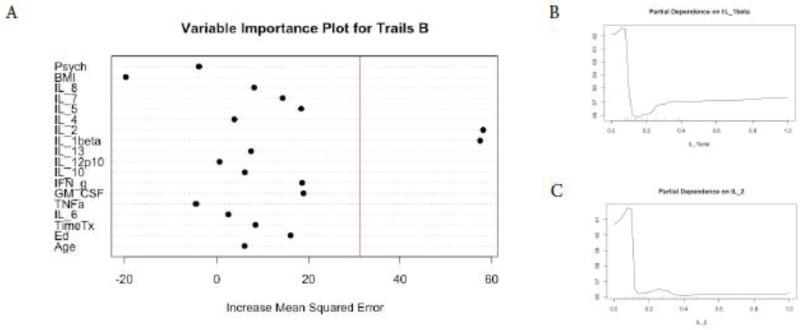
Figure 5. Random Forest Regression Trails B as Dependent Variable.
The Variable importance plot (A) for Trails B scores illustrates that IL-1 beta and IL-2 have the highest Increased Mean Squared Error in the model and therefore the most important predictors of Trails B scores. The red line represents the a prior threshold (1 SD above the mean) for determining the most important model features. The partial dependence plot for Trails B scores on IL-1 beta levels (B) IL-2 levels (C) illustrate the marginal effect of these cytokines on Trails B scores after partialling out the influence of all other variables in the model.

