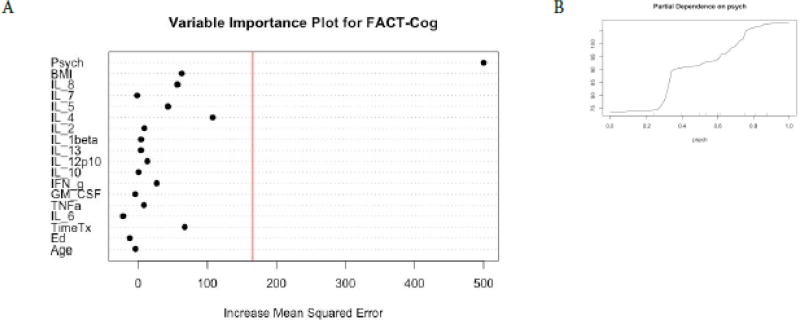
Figure 6. Random Forest Regression with FACT-Cog as Dependent Variable.
The Variable importance plot (A) for Fact-Cog total scores illustrates that none of the cytokine features were important variables in predicting FACT-Cog scores. The red line represents the a prior threshold (1 SD above the mean) for determining the most important model features. The psychosocial composite score was the most important feature in this model. A partial dependence plot for Psych composite scores (B).

