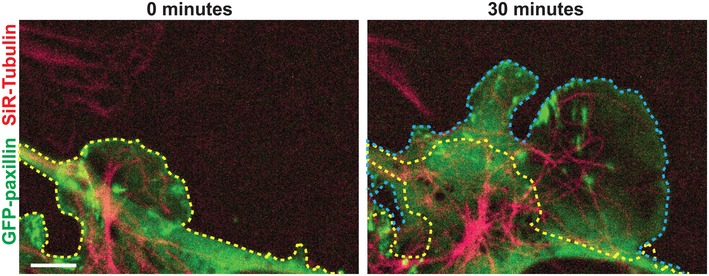
Figure EV1. Measuring microtubule extension into lamellipodium.

Schematic demonstrating how Fig 3C (right) was calculated. The yellow line indicates the edge of Pxn‐GFP (green)‐positive areas at 0 min, and the blue line indicates the edge at the end of 30 min. Microtubules were labelled red with SiRTubulin. Scale bar = 5 μm.
