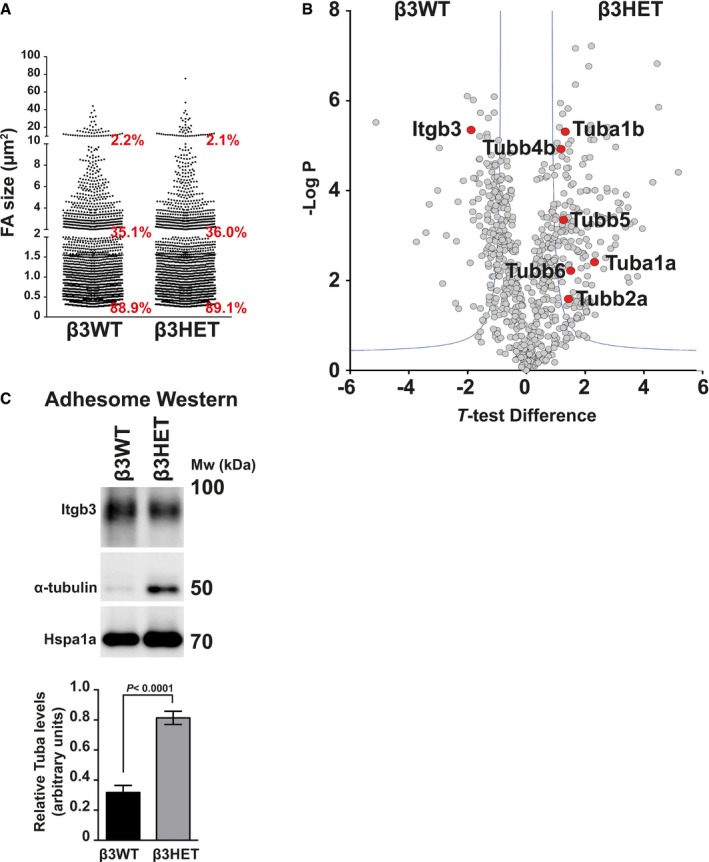
Figure 2. Analysis of the β3‐integrin‐dependent adhesome.

- Distribution of adhesion size classes (0–2 μm; 2–10 μm; > 10 μm) in β3WT versus β3HET endothelial cells (n = 1,400 FAs per genotype, from two independent experiments).
- Visual representation of the significance analysis of microarrays (SAM) method as a volcano plot for β3WT and β3HET samples (n = 3). t‐Test difference is plotted against −log of the P‐value. The blue lines show the cut‐off for significance as defined by the SAM. Integrin‐β3 (Itgb3) as well as all detected tubulins (Tub) have been highlighted as red points.
- Adhesome samples from β3WT and β3HET endothelial cells adhered to fibronectin. Samples were Western‐blotted for integrin‐β3 (Itgb3), α‐tubulin and heat‐shock protein 70 (Hspa1a). Blot shown is representative of the five individual experiments that are quantified in the bar graph below. Bars = mean (±SEM) relative α‐tubulin levels normalised to Hspa1a levels. Significant differences between means were evaluated by unpaired two‐tailed Student's t‐test.
