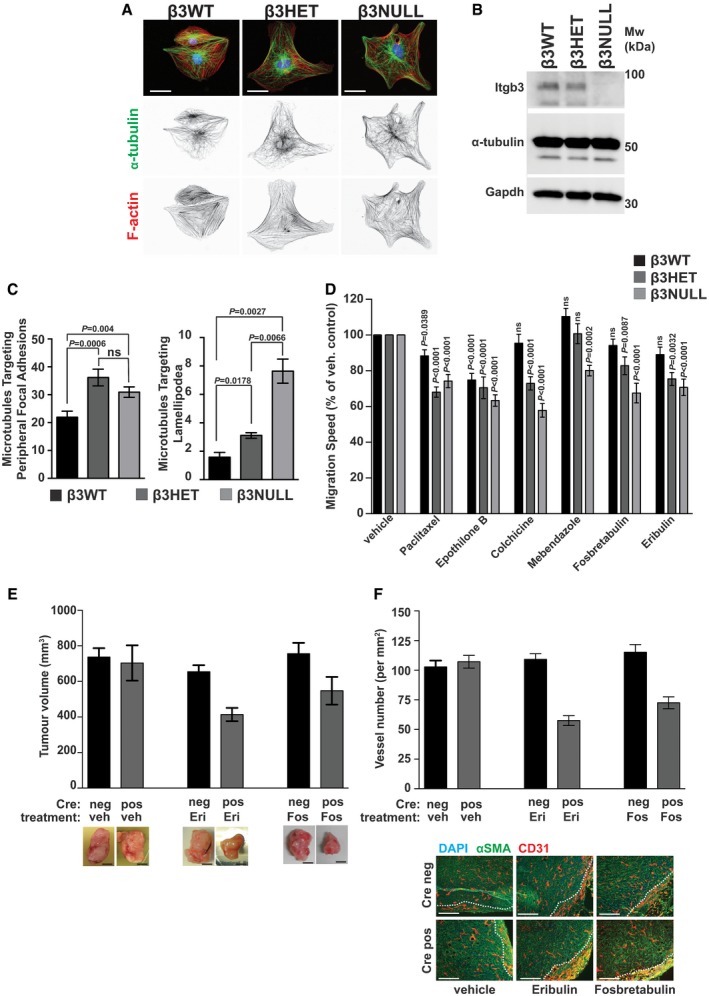
Figure 3. Analysis of microtubules in β3WT, β3HET and β3NULL endothelial cells.

- β3WT, β3HET and β3NULL endothelial cells were adhered to fibronectin‐coated coverslips for 90 min before being PHEMO fixed and immunostained for α‐tubulin (green). Nuclear (DAPI, blue) and phalloidin (F‐actin, red) stains were also used. Inverted black and white images of α‐tubulin and F‐actin are shown below the three‐colour overlays. Scale bar = 10 μm.
- β3WT, β3HET and β3NULL endothelial cells were adhered to fibronectin for 90 min before being lysed and Western‐blotted for integrin‐β3 (Itgb3), α‐tubulin and Gapdh (as a loading control).
- Left: β3WT, β3HET and β3NULL endothelial cells were adhered to fibronectin‐coated coverslips for 90 min before being methanol (−20°C) fixed and immunostained for α‐tubulin and talin‐1. The number of microtubules that terminated (overlapping staining) at a talin‐1 containing focal adhesion was counted for each genotype (n = 15 cells per genotype, from three independent experiments). Right: β3 WT, HET and NULL ECS were transfected with paxillin‐GFP and left to recover overnight. The cells were then adhered to fibronectin‐coated coverslips and allowed to recover for 3 h before being treated with 100 nM SiRTubulin and 1 μM verapamil overnight. The next day, fresh media containing SiRTubulin and verapamil (same dose) were added and cells were imaged every minute for 30 min (n = 3 cells per genotype, from three independent experiments). Areas of adhesive fronts were assessed by measuring the growth of paxillin–GFP‐positive areas between the 1st and 30th image. The number of microtubules that entered the adhesive front was quantified to give the number of microtubules entering lamellipodia relative to the area of adhesive fronts for each cell. Significant differences between means were evaluated by unpaired two‐tailed Student's t‐test. Error bars are ±SEM.
- β3WT, β3HET and β3NULL endothelial cells were adhered to fibronectin overnight. Migration speed of individual cells was measured over 15 h using the MTrackJ plugin for ImageJ under the influence of the indicated MTA. Migration speeds are shown as a percentage of the speed of the corresponding genotype under DMSO (vehicle) treatment (n ≥ 46 cells per genotype, from four independent experiments). Significant differences between means were evaluated by unpaired two‐tailed Student's t‐test. Error bars are ±SEM.
- β3flox/flox Tie1Cre‐positive (pos) and Cre‐negative (neg) animals were injected subcutaneously with 1 × 10⁶ CMT19T lung carcinoma cells and then treated with vehicle (veh), or Eribulin (Eri). Bar graph shows mean (±SEM) tumour volumes (n ≥ 6; from two to three independent experiments for each treatment condition) at the end of the experiment. Micrographs (below) show representative tumours. Scale bars = 5 mm.
- After excision, tumours from β3flox/flox Tie1Cre‐positive (pos) and Cre‐negative (neg) animals were processed and CD31 staining was assessed in vessel hot spots (see Materials and Methods) to measure vascular density. Bars = mean (±SEM) vessel number per mm2 (n = 5 sections from each genotype, taken over two to three independent experiments for each treatment condition). Micrographs (below) show representative images of sections stained for alpha‐smooth muscle actin (αSMA, green), CD31 (red), DAPI (blue). Dotted white line indicates border of tumour and surrounding connective tissue. Scale bars = 100 μm.
