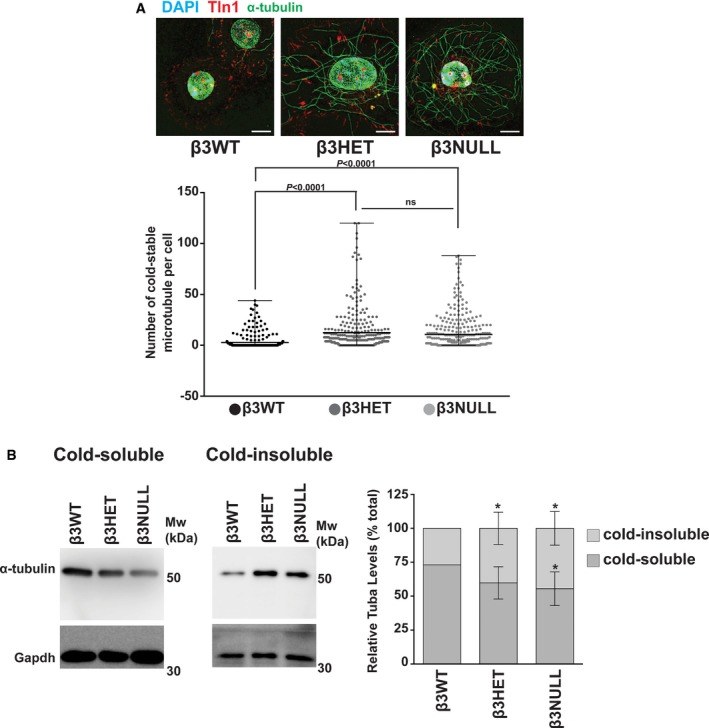
Figure 4. Analysis of microtubule stability in β3WT, β3HET and β3NULL endothelial cells.

- Top: β3WT, β3HET and β3NULL endothelial cells were adhered to fibronectin‐coated coverslips for 75 min at 37°C before being moved to ice for 15 min. Soluble tubulin was then washed out using PEM buffer (see Materials and Methods) before fixing with −20°C methanol (Note: this protocol leads to nuclear auto‐fluorescent background in all three channels used). Immunostaining was carried out for α‐tubulin (green) and talin‐1 (Tln1, red). DAPI (blue) was used as a nuclear stain. Images shown are representative of the data shown in the bar graph shown below. Scale bar = 5 μm. Bottom: Dot plots = mean (±SEM) number of cold‐stable microtubules per cell (n ≥ 300 cells per genotype, from three independent experiments). Significant differences between means were evaluated by unpaired two‐tailed Student's t‐test.
- β3WT, β3HET and β3NULL endothelial cells were adhered to fibronectin for 75 min at 37°C before being moved to ice for 15 min. Cold‐soluble tubulin (left blot) was then washed out using PEM buffer and Western‐blotted for α‐tubulin and Gapdh (as a loading control). Cold‐insoluble tubulin (middle blot) from the same cells was obtained by lysing the remaining cells and Western blotting for α‐tubulin and Gapdh (as a loading control). Right bar chart: Bars = mean (±SEM) relative cold‐soluble and cold‐insoluble α‐tubulin levels for each genotype. Data are representative of four independent experiments. *indicates statistical significance compared to WT (P < 0.05). Significant differences between means were evaluated by unpaired two‐tailed Student's t‐test.
