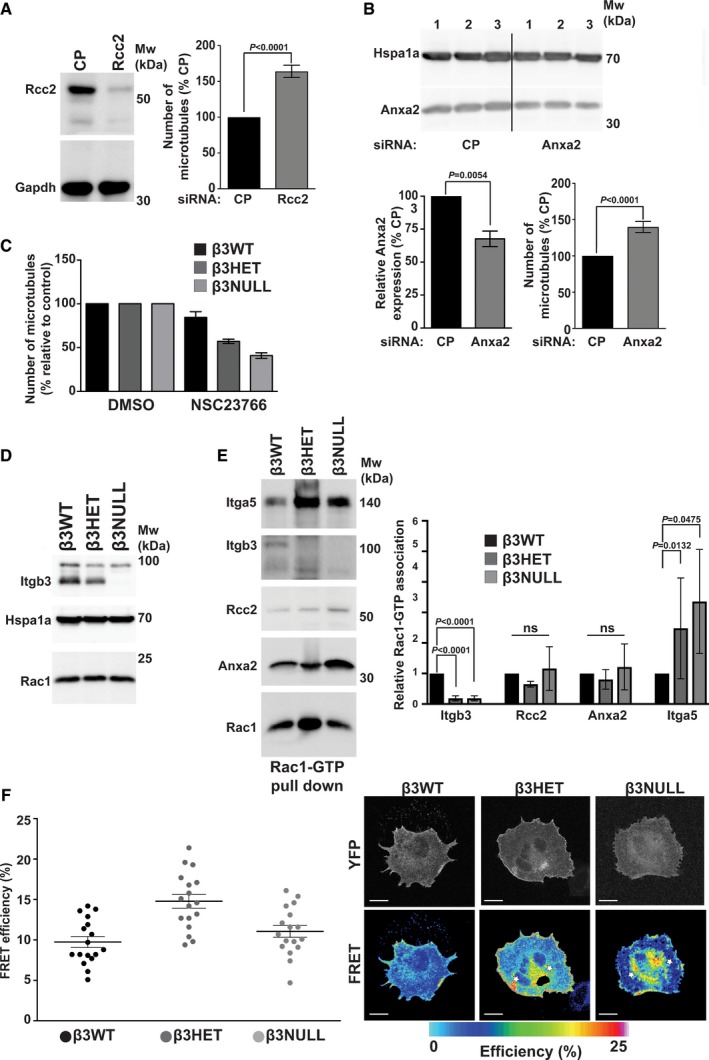
Figure 5. Microtubule stability in endothelial cells is regulated by Itgb3, Rcc2, Anxa2 and Rac1.

- β3WT ECs were transfected with control pool (CP) or Rcc2 smart pool siRNA and allowed to recover for 48 h. They were then adhered to fibronectin‐coated coverslips for 75 min at 37°C before being moved to ice for 15 min. Soluble tubulin was then washed out using PEM buffer before fixing with −20°C methanol. Immunostaining was carried out for α‐tubulin to allow counting of the number of cold‐stable microtubules per cell. Left: Western blot showing representative Rcc2 knockdown. Gapdh is shown as a loading control. Right: Bars = mean (±SEM) number of cold‐stable microtubules shown as a percentage relative to CP‐treated cells (n ≥ 455 cells per condition, from three independent experiments). Significant differences between means were evaluated by unpaired two‐tailed Student's t‐test.
- β3WT ECs were transfected with control pool (CP) or Anxa2 smart pool siRNA and allowed to recover for 48 h. They were then adhered to fibronectin‐coated coverslips for 75 min at 37°C before being moved to ice for 15 min. Soluble tubulin was then washed out using PEM buffer before fixing with −20°C methanol. Immunostaining was carried out for α‐tubulin to allow counting of the number of cold‐stable microtubules per cell. Top: Western blot showing representative Anxa2 knockdown in three separate samples. Bottom left: Bars = mean (±SEM) Anxa2 knockdown shown as a percentage relative to CP‐treated cells. Samples have been normalised to Hspa1a. Bottom right: Bars = mean (±SEM) number of cold‐stable microtubules shown as a percentage relative to CP‐treated cells (n ≥ 450 cells per condition, from three independent experiments). Significant differences between means were evaluated by unpaired two‐tailed Student's t‐test. The graph is representative of 3 independent experiments.
- β3WT, β3HET and β3NULL endothelial cells were adhered to fibronectin‐coated coverslips for 60 min at 37°C before being treated with DMSO (control) or 50 μM NSC23766 and incubated at 37°C for a further 15 min. Coverslips were moved to ice for 15 min. Soluble tubulin was then washed out using PEM buffer before fixing with −20°C methanol. Immunostaining was carried out for alpha‐tubulin to allow counting of the number of cold‐stable microtubules per cell. Bars = mean (±SEM) number of microtubules per cell shown as a percentage relative to DMSO‐treated controls (n = 218 cells per condition, from two independent experiments).
- β3WT, β3HET and β3NULL endothelial cells were adhered to fibronectin for 90 min before being lysed and Western‐blotted for integrin‐β3 (Itgb3), Rac1 and Hspa1a (as a loading control). Blot shown is representative of three individual experiments.
- β3WT, β3HET and β3NULL endothelial cells were adhered to fibronectin‐coated plates for 90 min before being lysed in MLB (see Materials and Methods). GTP‐Rac1 and bound proteins were extracted from cleared MLB using PAK‐1 PBD magnetic beads at 4°C for an hour before being Western‐blotted for Itga5, Itgb3, Rcc2, Anxa2 and Rac1. Blot is representative of at least three independent experiments Right: Bars = mean (±SD) level of association of the indicated protein with GTP‐Rac1, shown relative to β3WT associations (and normalised to the level of active Rac1 pulled down). Results are from at least three independent experiments. Significant differences between means were evaluated by unpaired two‐tailed Student's t‐test.
- β3WT, β3HET and β3NULL endothelial cells were transfected with a Raichu‐Rac1 biosensor. After 48 h, cells were adhered to fibronectin‐coated plates for 90 min and then fixed in PFA. Left: FRET efficiency was measured as described in Materials and Methods. Graph shows mean FRET efficiencies (±SEM; n = 17 cells per genotype, from two independent experiments). Right: Representative images showing spatial distribution of Rac1 FRET efficiency in β3WT, β3HET and β3NULL endothelial cells (white stars indicate cytoplasmic localisation of active Rac1 in β3HET and β3NULL). Scale bar = 5 μm.
