
Figure 1. Paralogous MT‐associated proteins Map7 and Map7D1 are required for cell‐substrate adhesion and migration in HeLa cells.
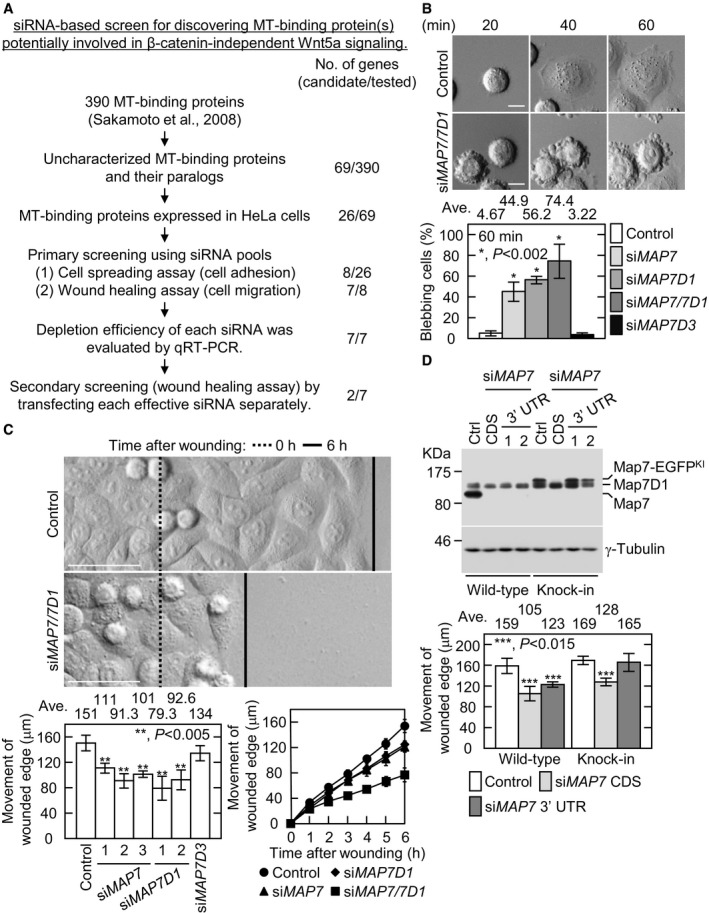
- Experimental flow chart for the siRNA‐based screen in HeLa cells to discover MT‐binding protein(s) potentially involved in β‐catenin‐independent Wnt5a signaling. For details, see Materials and Methods.
- Images of the indicated cells at various times after being replated on a fibronectin‐coated glass‐bottom dish (top). Lamellipodial extension was observed during cell‐substrate adhesion in control cells. Defective cell adhesion caused membrane blebbing instead of lamellipodial extension. Graph shows the percentage of blebbing cells 60 min after replating.
- Images of the indicated cells after inducing cell migration (top). Dotted and solid lines show the wounded edge 0 or 6 h after wounding, respectively. Average distance moved by the wounded edge 6 h after wounding (lower left). HeLa cells were transfected with validated CDS‐targeting siRNAs. Map7D3 was depleted with a mixture of three validated siRNAs (see Appendix Fig S3C). Distance moved by the wounded edge was measured over time after wounding in the indicated cells (lower right). Map7 or Map7D1 was depleted with a mixture of three or two validated siRNAs, respectively. For the double depletion, cells were treated with combined siRNAs against Map7 and Map7D1.
- Depletion efficiency of Map7 in wild‐type or Map7‐EGFPKI cells transfected with the indicated siRNAs (top). At 72 h post‐transfection, the protein level of Map7 was analyzed with an anti‐Map7 antibody. Graph shows the average distance moved by the wounded edge 6 h after wounding. siMAP7 CDS, Map7 was depleted with a mixture of three validated siRNAs targeting the CDS. siMAP7 3′ UTR, Map7 was depleted with a mixture of two validated siRNAs targeting the 3′ UTR.