
Figure EV1. The experimental representation of cortical accumulation of Dvl2‐EGFPKI induced by ectopic expression of Rac1CA .
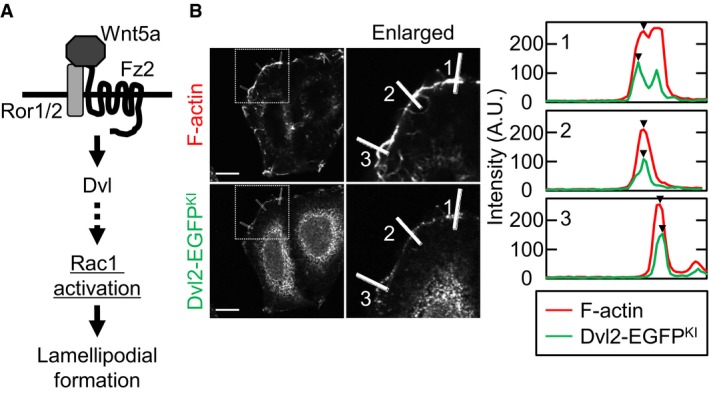
- Scheme of the Wnt5a signaling pathway.
- Intensities of the F‐actin and Dvl2‐EGFPKI signals were measured at three different points in the lamellipodia, and representative results are shown at right. Arrow heads indicate the measurement point of each intensity. Scale bar, 10 μm.