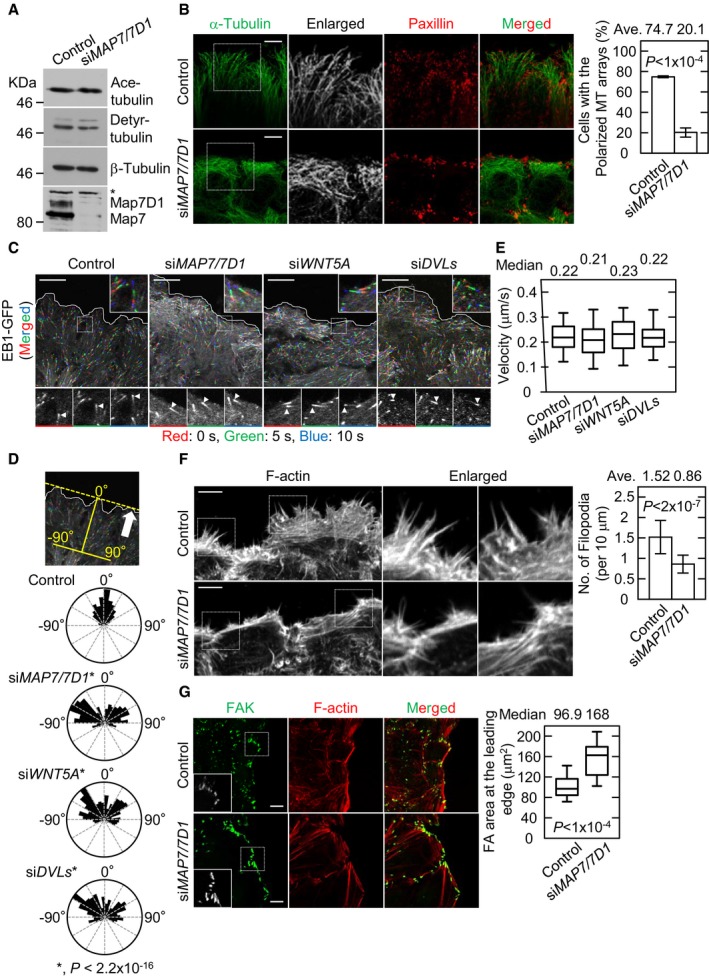
Immunoblot analysis for detyrosinated (Detyr‐) and acetylated (Ace‐) tubulins in the indicated cells. β‐Tubulin (loading control) and Map7/7D1 were also analyzed. Asterisk shows unspecific band.
Images of peripheral MT arrays at the leading edge in the indicated cells 1 h after wounding (left). Images were focused on the Paxillin signal, a marker of focal adhesions (FAs), because the polarized MT arrays were observed close to the adherent side of the cells. Graph shows the percentage of cells with polarized MT arrays (from three independent experiments).
Dynamics of EB1‐GFP comets observed by live‐cell imaging 1 h after wounding (left). Time‐lapse images were taken at 5‐s intervals for 2 min (see
Movies EV2,
EV3,
EV11 and
EV12). Comet trails were measured at three time points (red: 0 s, green: 5 s, blue: 10 s) in the indicated cells (arrowheads).
The measurement of the vector angle of EB1‐GFP comets with respect to the leading edge (top). The vector angle of 0° indicates direction toward the leading edge. Arrow indicates the direction of migrating cells. Rose diagram shows the vector angle of EB1‐GFP comets in the indicated cells (control, n = 328 comets; siMAP7/7D1, n = 277 comets; siWNT5A, n = 318 comets; siDVLs, n = 320 comets from three independent experiments).
Graph shows the velocity of EB1‐GFP comets in the indicated cells (control, n = 270 comets; siMAP7/7D1, n = 270 comets; siWNT5A, n = 450 comets; siDVLs, n = 300 comets from three independent experiments).
Images of filopodia at the leading edge in the indicated cells 1 h after wounding (left). Graph shows the number of filopodia at the leading edge of the front cells divided by the length of the leading edge. Twenty images (1,024 × 1,024 pixels, one image included about 4–5 front cells) from four independent experiments were analyzed for each cell type.
FAs at the leading edge in the indicated cells 1 h after wounding (left). FAs were visualized by staining for focal adhesion kinase (FAK). Graph shows the FA area at the leading edge of the front cells measured 1 h after wounding (control, n = 114 cells; siMAP7/7D1, n = 81 cells from four independent experiments).
Data information: Panels in (B–D, F, and G) are arranged to show that cells are migrating in an upward direction. Scale bars, 10 μm in (B, C, F, and G). Data shown in (B and F) are from three or four independent experiments, and represent the average ± SD. The bars of box‐and‐whisker plots show the 5 and 95 percentiles, and the box limits are the 1
st and 3
rd quartile in (E and G). Statistical significance was tested with the Student's
t‐test in (B and E–G) or the Mardia‐Watson‐Wheeler test in (D).
Source data are available online for this figure.