
Figure 4. Map7/7D1 direct Dvl localization to the cell cortex.
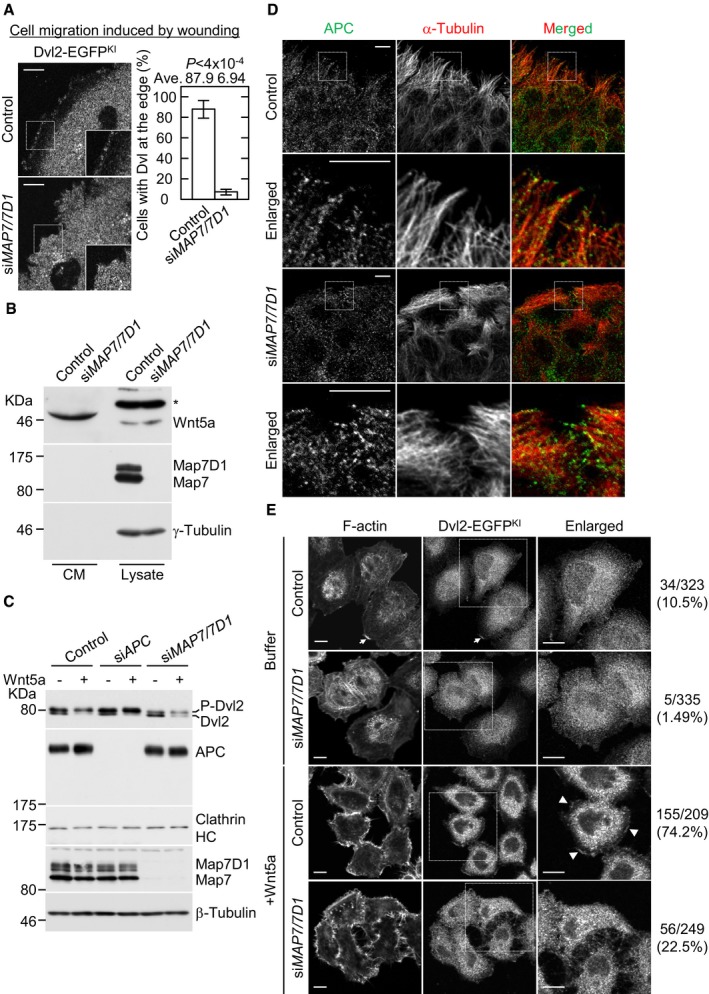
- Live‐cell imaging of Dvl2‐EGFPKI cells 1 h after wounding. Movies were taken at 10‐s intervals for 3 min (see Movies EV4 and EV5). Graph shows the percentage of cells with accumulated Dvl2‐EGFPKI at the cell periphery. Data are from four independent experiments and represent average ± SD. Statistical significance was tested with the Student's t‐test.
- Effects of Map7/7D1 depletion on the secretion and expression levels of Wnt5a. Conditioned medium and lysates derived from the indicated cells were separated on SDS–PAGE and were immunoblotted with an anti‐Wnt5a antibody. To assess the levels of Map7/7D1 depletion and loading control, the blot was reprobed for Map7/7D1 and γ‐tubulin, respectively. Asterisk shows unspecific band.
- Effects of Map7/7D1 depletion on the expression levels of Dvl and APC. Lysates derived from the indicated cells were separated by SDS–PAGE and were immunoblotted with anti‐Dvl2 and APC antibodies. The blots were reprobed for Clathrin heavy chain (HC) or γ‐tubulin as a loading control. The phosphorylation state of Dvl2 was confirmed by its mobility shift. P‐Dvl2 represents phosphorylated Dvl2.
- Localization of APC at the leading edge in the indicated cells. Cells were fixed 1 h after wounding, and stained for α‐tubulin and APC.
- A strong cortical accumulation of Dvl2‐EGFPKI was induced by purified Wnt5a (100 ng/ml). Cells were fixed 1 h after treatment with buffer or Wnt5a. The percentage of cells in which Dvl2‐EGFPKI was accumulated at the cell periphery was calculated (control with buffer, n = 323; siMAP7/7D1 with buffer, n = 335 cells; control with Wnt5a, n = 209 cells; siMAP7/7D1 with Wnt5a, n = 249 cells). Arrows indicate cortical Dvl2‐EGFPKI at the corresponding lamellipodia in buffer‐treated control cells. Arrow heads indicate cortical Dvl2‐EGFPKI at the lamellipodia in Wnt5a‐treated control cells.