
Figure 8. Polarized distribution of Map7/7D1 and the Drosophila ortholog, Ens in epithelial tissues.
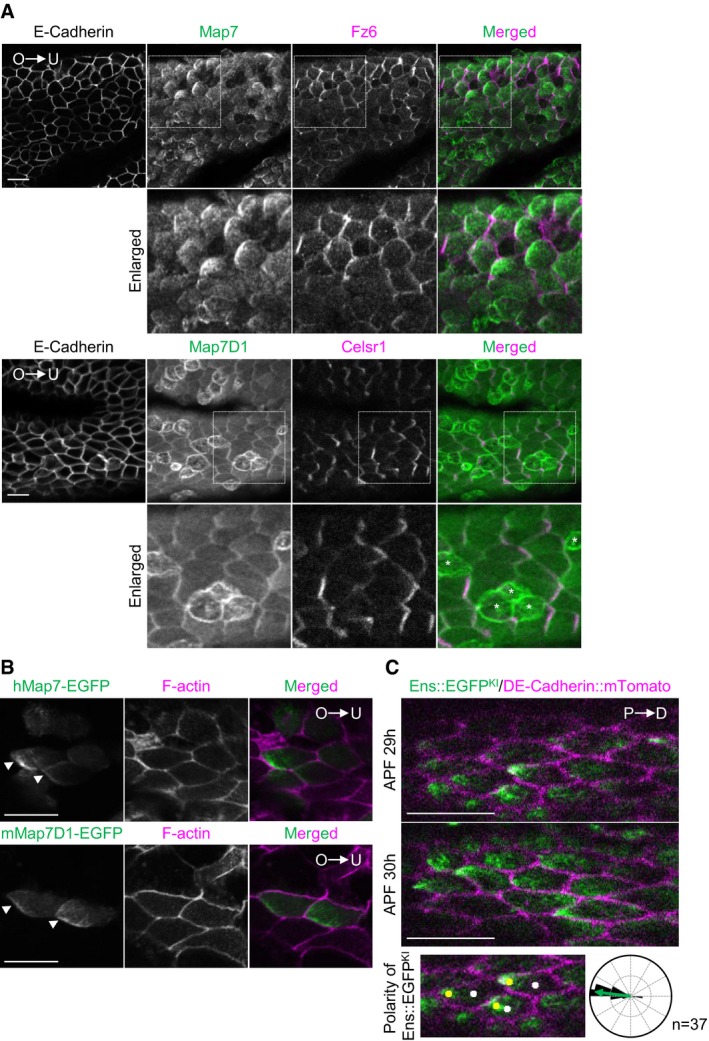
- Immunofluorescence images of Map7 (top) or Map7D1 (bottom) in the ciliated epithelium of the mouse oviduct. Fz6 and Celsr1 were used as markers for PCP orientation, and E‐Cadherin for cell boundaries. O, ovary side; U, uterus side. Asterisks show the secretory cells.
- Subcellular localization of hMap7‐EGFP or mMap7‐EGFP in multiciliated cells of the mouse oviduct. A hMap7‐EGFP or mMap7‐EGFP expression construct was transfected into the oviduct by electroporation. The oviduct was fixed with paraformaldehyde, and stained with Phalloidin to visualize cell boundaries. Arrow heads indicate the polarized localization of hMap7‐EGFP or mMap7D1‐EGFP at the ovary side of multiciliated cells.
- Live‐cell imaging of the pupal wing in an Ens::EGFPKI fly expressing DE‐Cadherin::mTomato at 29 and 30 h APF. P, proximal side; D, distal side. The subcellular distribution of Ens::EGFPKI was evaluated as follows: The cell boundary of individual cells was first outlined manually, and the point of the center of each cell was calculated (white dots). Next, after binarizing images of Ens::EGFPKI, the mass of Ens::EGFPKI was outlined, and the point of the center of its mass was calculated (yellow dots). Then, angles of vector between two points were calculated and were plotted on rose diagrams (n = 37 cells). The median angle is represented by green arrow.