
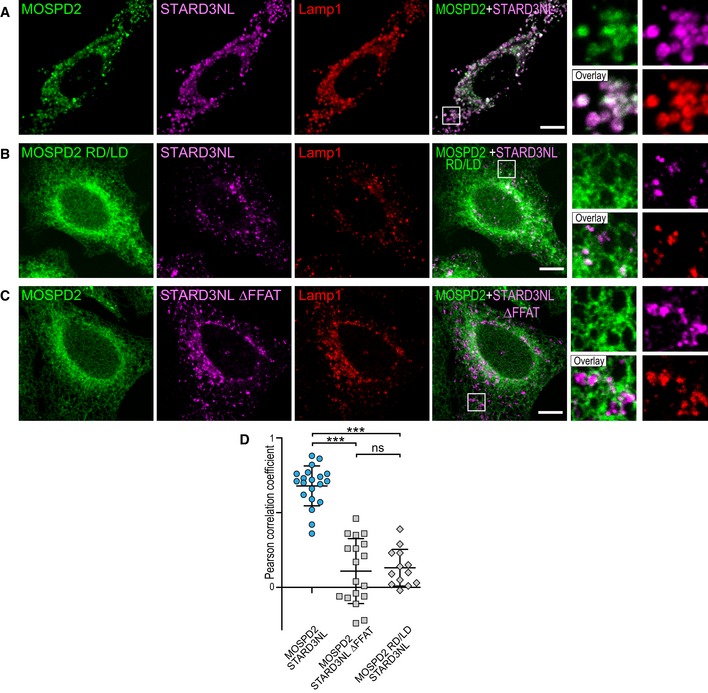
Figure 7. FFAT motif‐dependent recruitment of MOSPD2 in ER–endosome contacts by STARD3NL.
-
A–CGFP‐MOSPD2‐ (A and C) and GFP‐MOSPD2 RD/LD‐expressing cells (B) were transfected with Flag‐STARD3NL (A and B), or Flag‐STARD3NL ΔFFAT (C), and labeled using anti‐Flag (magenta) and anti‐Lamp1 (late endosomes/lysosomes marker; red) antibodies. The subpanels on the right are higher magnification (3.5×) images of the area outlined in white. The Overlay panel shows merged green and magenta images. Scale bars: 10 μm.
-
DPearson's correlation coefficients between MOSPD2 (WT or RD/LD mutant) and STARD3NL (WT or ΔFFAT) staining are shown. Each dot represents a single cell (number of cells: MOSPD2–STARD3NL: 20; MOSPD2–STARD3NL ΔFFAT: 18; MOSPD2 RD/LD–STARD3NL: 13, from three independent experiments). Means and error bars (SD) are shown. Kruskal–Wallis with Dunn's multiple comparison test (***P < 0.001).