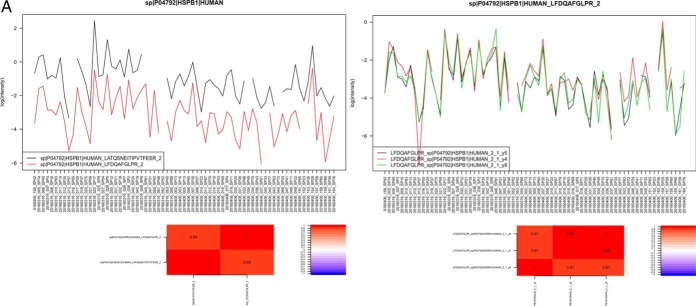
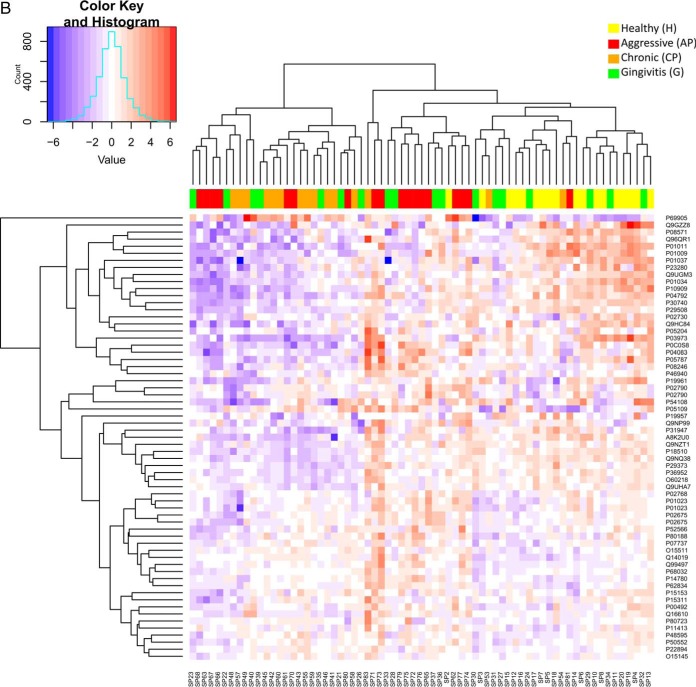
Fig. 3.
A, Quality check (QC) of SRM measurements on precursor and protein level. Top panel shows a line plot of the light to heavy ratios of the tree fragments y4, y5, y8 for peptide LFDQAFGLPR in all samples, whereas the bottom panel shows the light to heavy ratios of the two peptides quantified for protein HSPB1. The heatmap on the bottom envisages the correlation between the petides, to the right one can see the color scale used to encode the correlation [−1,1]. B, Heat map of all quantified proteins in the studied groups (H, G, AP, CP). Each column represents an individual saliva sample, and each row represents an individual protein. Clustering separating samples into sub-groups as Healthy (H): Yellow, Gingivitis (G): Green, Aggressive Periodontitis (AP): Red, Chronic Periodontitis (CP): Orange.


