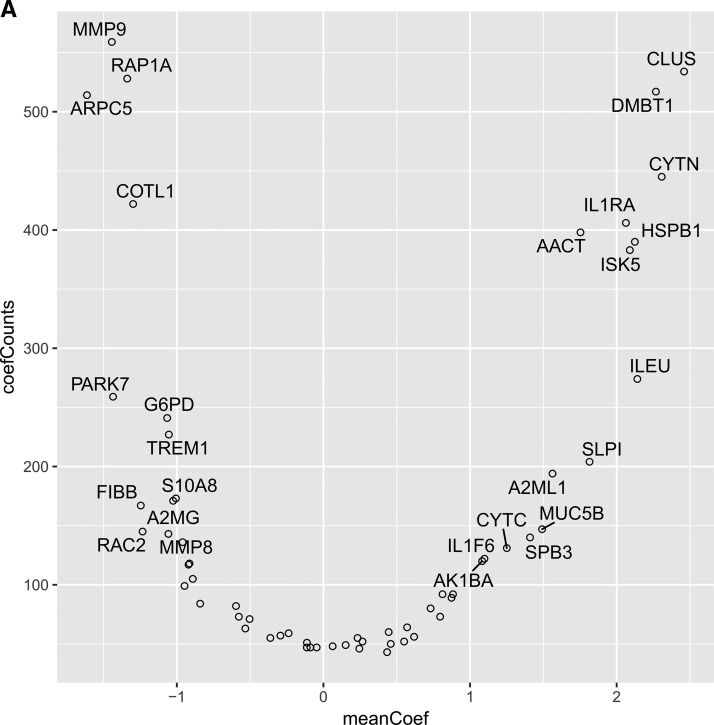
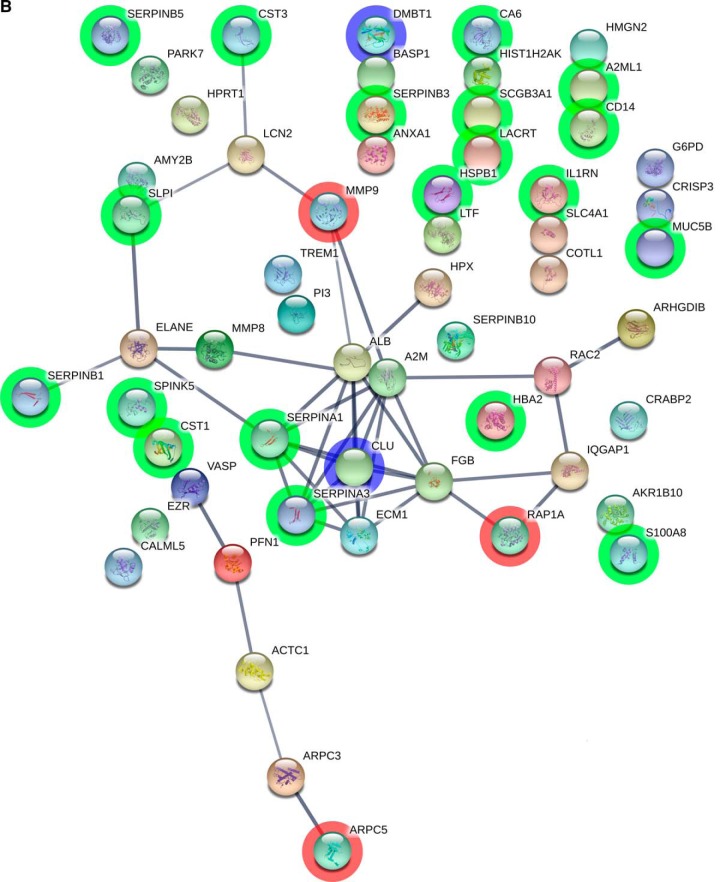
Fig. 5.
A, Histogram of AUC for all 34220 fitted models. Red line - AUC 90% quantile. Variables frequency (y axis) and average absolute coefficient weights (x axis) in top 10% of models (3422) with AUC range 0.90–0.97. B, STRING visualization of the proteins quantified by SRM. The nodes are the proteins and the connecting lines represent STRING interaction. Highlighted green are the proteins with a significant p value and log2 fold change larger or smaller than 1. In blue are marked the proteins which have passed the p value and fold change threshold as well as were most frequently used by the logistic regression models (CLUS and DMBT1). In red are the proteins which were used by the logistic regression models but did not have a fold change larger than 2 (MMP9, ARPC5 and RAP1A).


