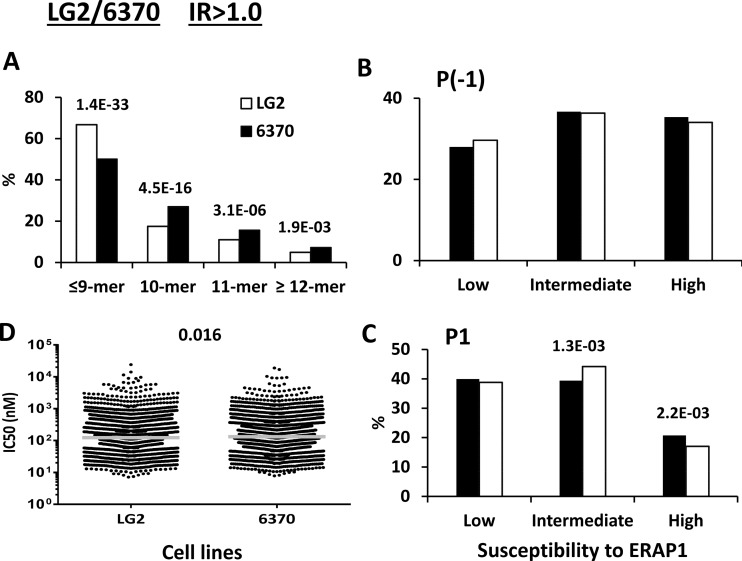
Fig. 2.
Comparison of the shared peptides between LCL LG2 and 6370: IR>1.0 subsets. A total of 2444 (LG2: white bars) and 2869 (6370: black bars) peptides were included in the IR>1.0 subset from each cell line. A, Peptide length distribution, B, Percentage of P(-1) residues with low, intermediate and high susceptibility to ERAP1, C, Percentage of P1 residues with low, intermediate and high susceptibility to ERAP1, D, theoretical affinity of the peptides for B*27:05, as estimated by their IC50 values. When the differences reached statistical significance, this was indicated by their p values.

