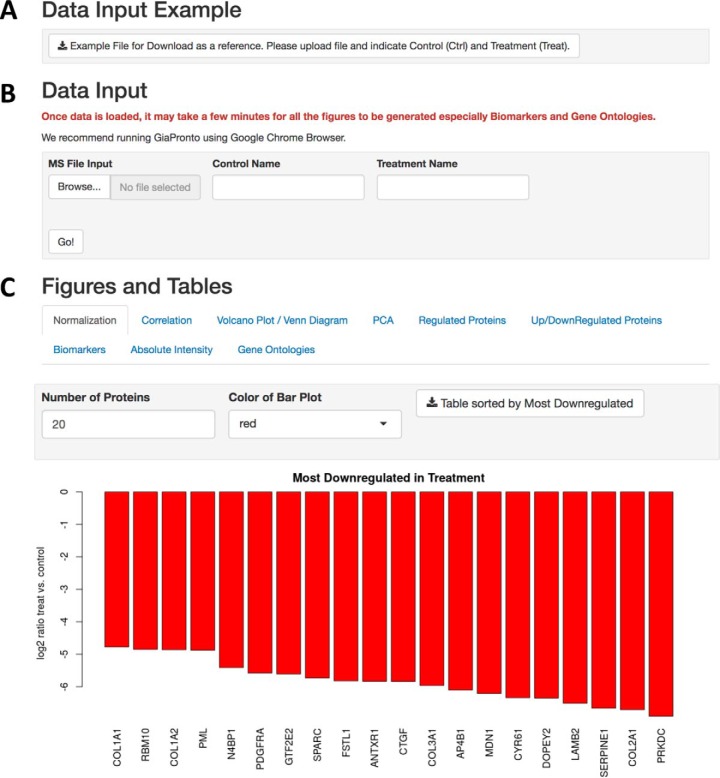
Fig. 1.
Graphical User Interface. A, GiaPronto provides an example file to aid the user in formatting their data for analysis. B, In data input section, the user can specify the control and treatment sample names will be used to generate the graphs, figure legends and Tables in the output. C, The output is partitioned into tabs and each figure is completely interactive where the user can customize the parameters.

