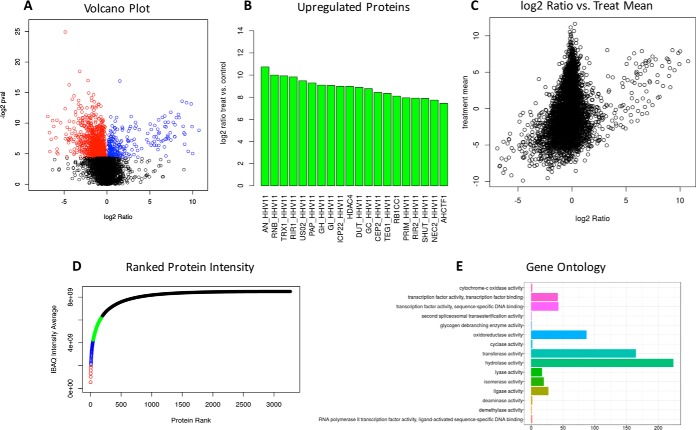
Fig. 3.
Statistical Analysis and Identification of Relevant Proteins. A, Our software uses a t test to determine statistically significant proteins between experimental conditions. A volcano plot is displayed, which allows the user to determine proteins that are both significant and have a substantial fold change between treatment and control. B, GiaPronto displays proteins that are up-regulated and downregulated in response to modulation. C, Lastly, potential biomarkers are determine by examining proteins that are both abundant (intensity of signal) and sample specific (high fold change). The comprehensive list of regulated proteins and biomarkers can be exported in an excel table for additional analysis. D, GiaPronto plots the protein absolute intensity by dividing proteins into quartiles based on their abundance. The top 25% of proteins are displayed in red and the lowest 25% are shown in black. E, Our software performs gene ontologies using clusterProfiler to examine changes in biological process, molecular function and cellular component.

