Fig. 3.

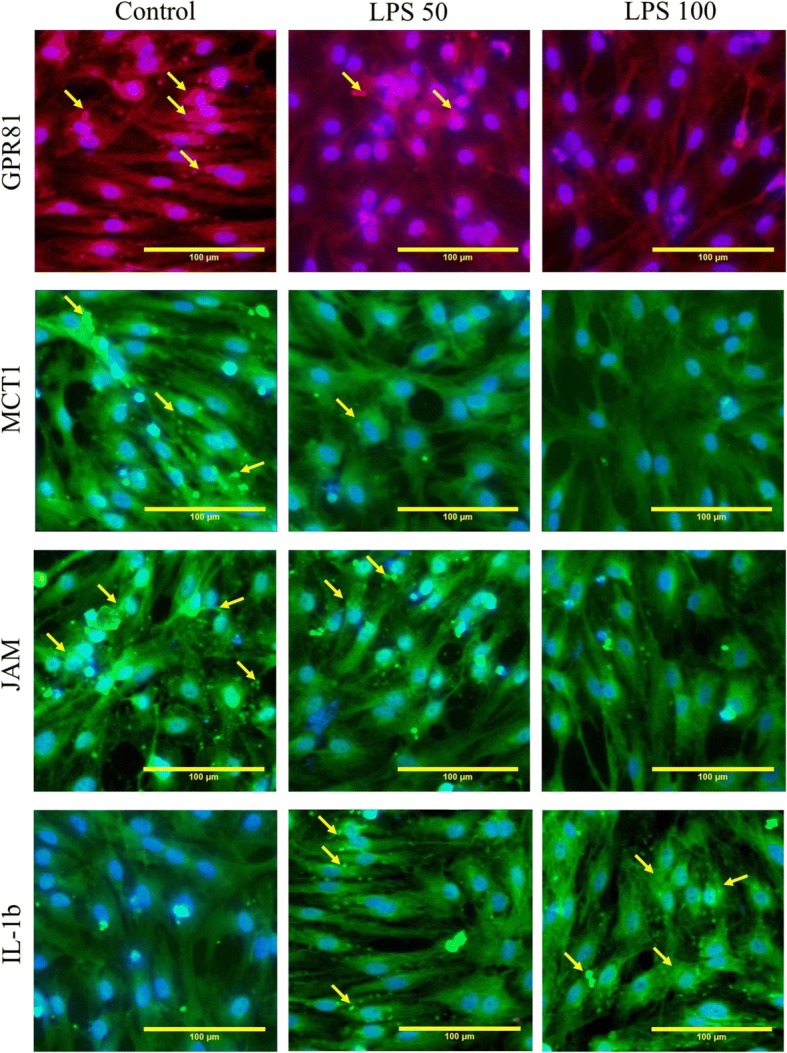
Microphotographs of endothelial monolayer in the model of BBB in vitro. The photos show GPR81, MCT-1JAM, and IL-1β expression after incubations of BMECs with LPS50 (n = 8), LPS100 (n = 8), or in the control group (n = 8). Scale bars 100 μm

Microphotographs of endothelial monolayer in the model of BBB in vitro. The photos show GPR81, MCT-1JAM, and IL-1β expression after incubations of BMECs with LPS50 (n = 8), LPS100 (n = 8), or in the control group (n = 8). Scale bars 100 μm