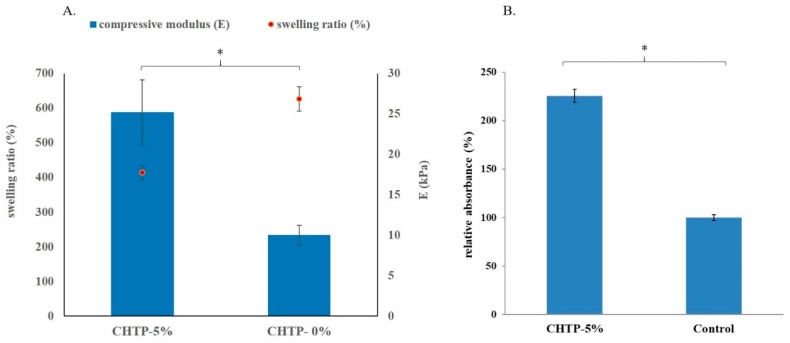
Figure 7.
(A) Swelling ratio (%) (data collected at soaking time of 120 min) (left y-axis) and compression modulus (E) (right y-axis) of CHT with and without OPCs added. CHTP-5% represents that 5% OPCs were applied to a CHT composite with 30% (w/w) of β-TCP added (CHT-30% or CHTP-0%); (B) Cell viability evaluated by MTT assay for CHTP composite material. Cell growth is expressed as the relative absorbance obtained over the control condition. Error bars represent standard deviations of triplicate measurements. * indicates significant difference (p < 0.05).

