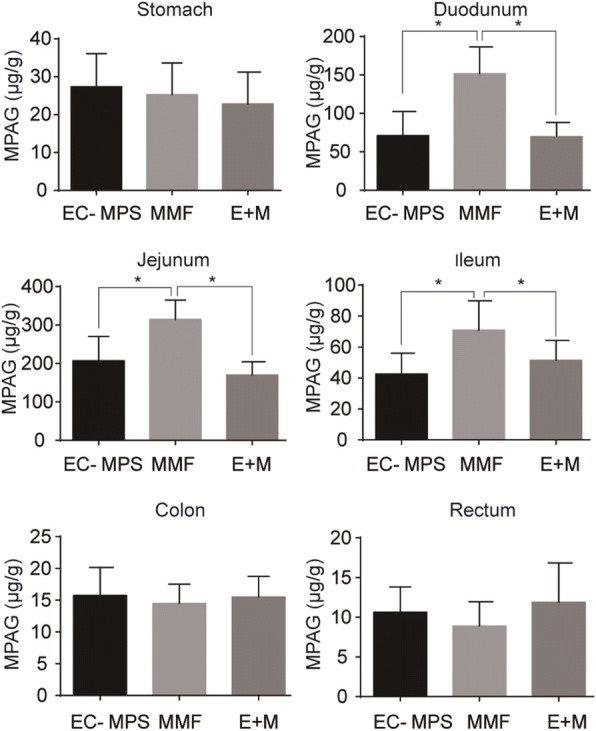
Fig. 4.

Comparisons of the MPAG levels in GI tract. Comparisons of the MPAG levels in stomach, duodenum, jejunum, ileum, colon, and rectum among rats treated with indicated drugs in (1) EC-MPS group; (2) MMF group; (3) EC-MPS + mofetil (E + M) group. MPAG levels in duodenum, jejunum, and ileum tissues were significantly higher in the MMF group than EC-MPS group (152.4 ± 24.34 vs 72.3 ± 24.23, p < 0.05; 312.3 ± 40.34 vs 208.5 ± 47.34, p < 0.05; 71.2 ± 28.22 vs 42.2 ± 16.43, p < 0.05) and EC-MPS+ mofetil group (152.4 ± 24.34 vs 72.1 ± 15.23, p < 0.05; 312.3 ± 40.34 vs 180.7 ± 21.14, p < 0.05; 71.2 ± 28.22 vs 52.4 ± 17.15, p < 0.05). There was no significant difference in the MPAG levels in stomach, colon, and rectum tissues among all these three groups. In all GI tissues, there are no significant difference between EC-MPS group and EC-MPS+ mofetil group
