
Fig. 1.
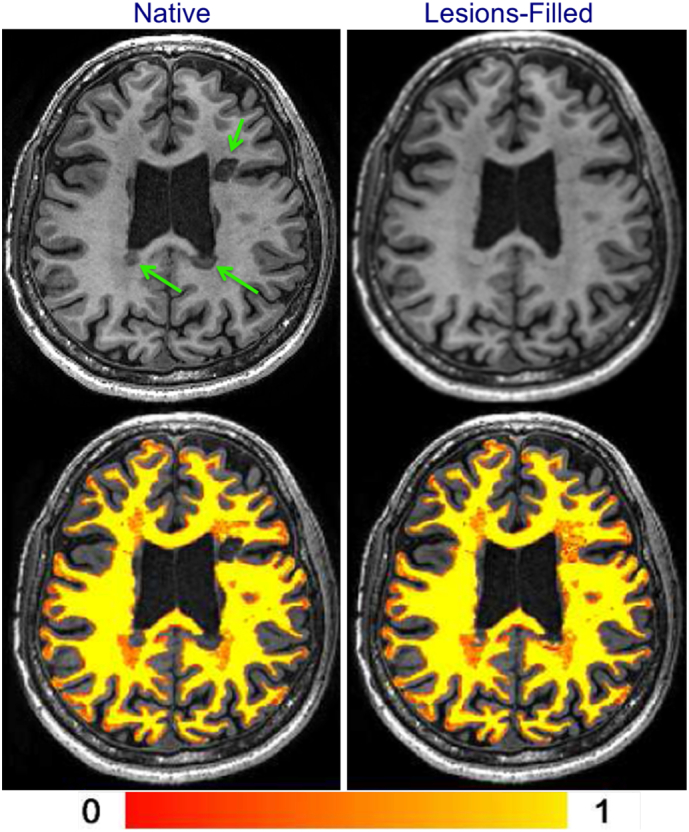
The effect of WM lesions on the segmentation using FSL-FAST software. Left column: The native (non-filled) T1-weighted image and its WM segmentation. Right column: T1-weighted image after lesion-filling and its WM segmentation. Arrows point to obvious WM lesions. Color bar indicates the WM partial volume estimate.
Reproduced in modified form with permission from Popescu et al. (2014).