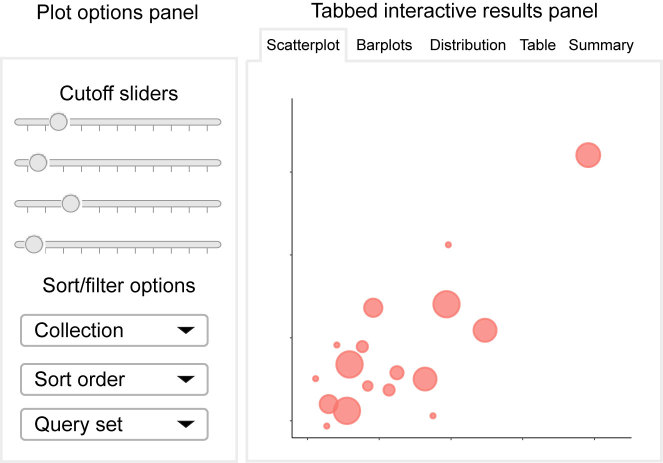
Figure 2.
Conceptual diagram of the LOLAweb interactive visualization environment. A display option panel (left side) contains cutoff sliders and select boxes that allow the user to adjust plot display preferences. The interactive results panel (right side) visualizes the top enrichments from the database, among other things and updates on-the-fly based on user input.

