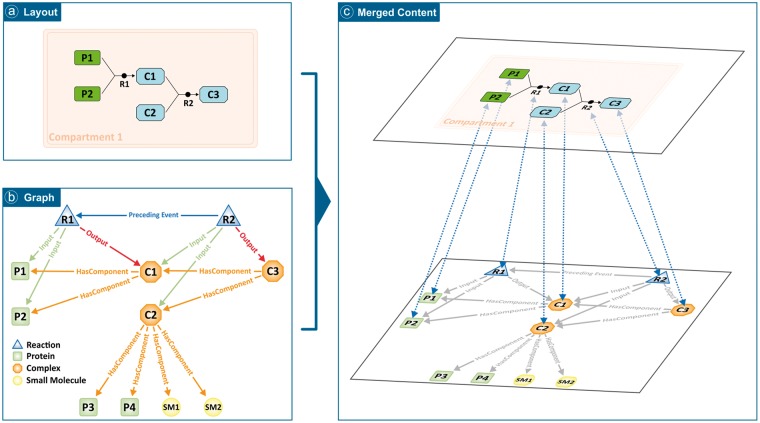
Fig. 1.
Schematic view of a pathway made up of two reactions. (a) The pathway diagram as presented to the final user. (b) Underlying graph with the whole content of the pathway. (c) Representation of the merging of both the diagram and graph on the client side. In the figure, Pn are proteins, SMn are chemicals, Cn are complexes and Rn are reactions. From the graph, it can be extracted that C1 contains [P1, P2], C2 contains [P3, P4, SM1, SM2] and C3 contains [C1, C2], but by traversing the graph it can be easily inferred that C3 actually contains [P1, P2, P3, P4, SM1, SM2]

