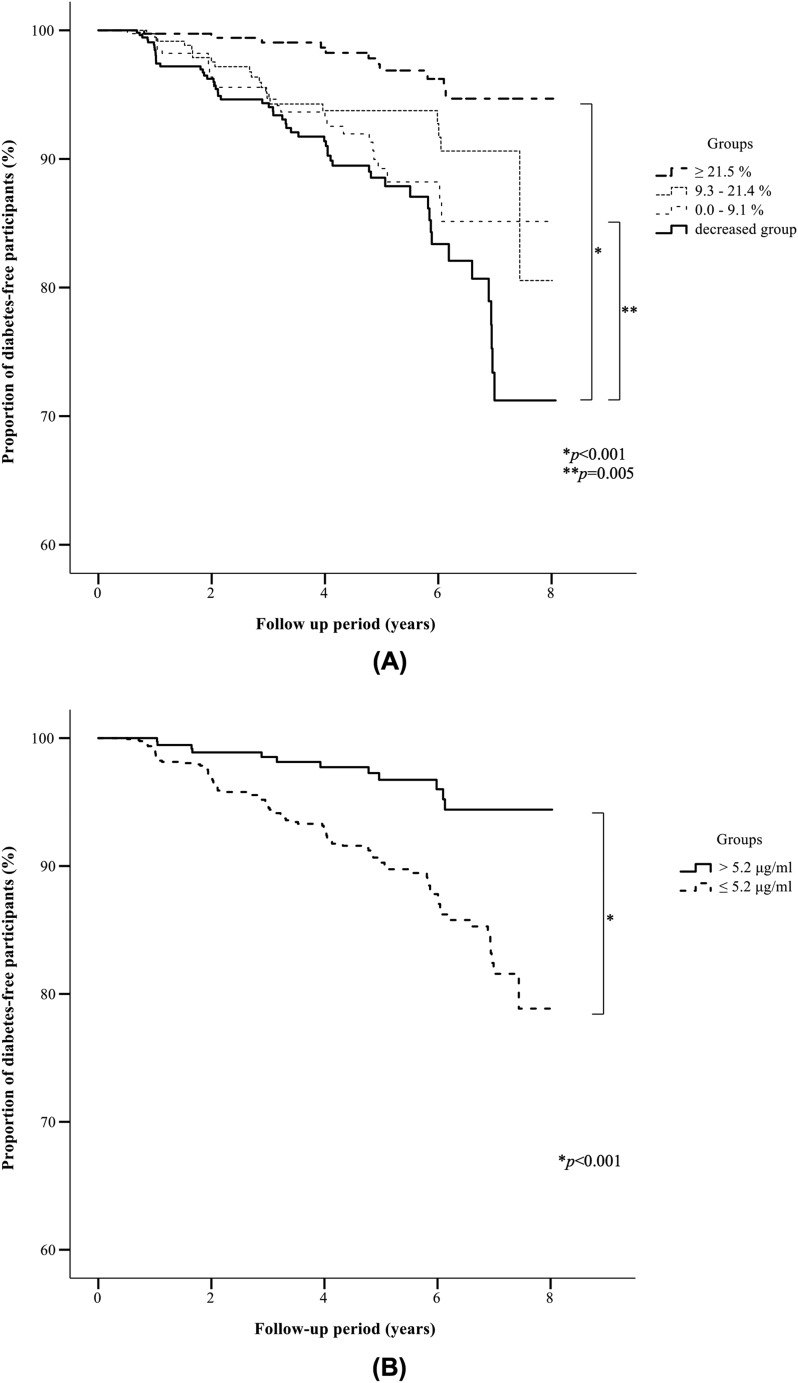
Figure 2.
Kaplan-Meier curves of the proportion of diabetes-free participants of the lowest baseline Ad group. (A) Kaplan-Meier curves of the proportion of diabetes-free participants of the %ΔAd-increased subgroups of the lowest baseline Ad group. The cumulative incidence rates of T2DM for subjects of the %ΔAd-increased subgroups (largest, ≥21.5%; second largest, 9.3% to 21.4%; third largest, ≤9.1%) and the %ΔAd-decreased subgroup were 2.9%, 5.5%, 7.0%, and 9.9%, respectively. The cumulative incidence rate was significantly lower in subjects of the largest (≥21.5%) and second largest (9.3% to 21.4%) %ΔAd-increased subgroups than in the %ΔAd-decreased subgroup (P < 0.001 and P = 0.005, respectively). (B) Kaplan-Meier curves of the proportion of diabetes-free participants of the endpoint Ad subgroups of the lowest baseline Ad group. The cumulative incidence rates of T2DM for subjects of the endpoint Ad subgroups (endpoint Ad >5.2 and ≤5.2 μg/mL) were 3.0% and 7.8%, respectively. The cumulative incidence rate was significantly lower in the endpoint Ad >5.2 μg/mL subgroup than in the endpoint Ad ≤5.2 μg/mL subgroup (P < 0.001).

