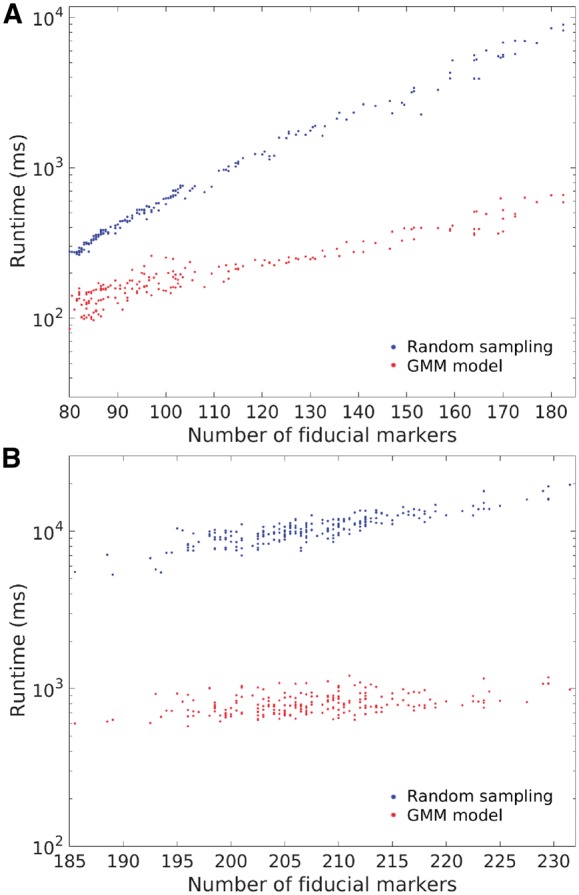
Fig. 5.

Runtime of the proposed GMM-based method (in red) and the previous random sampling-based method (Han et al., 2015) (in blue) on (A) the Hemocyanin dataset and (B) the Adhesion belt dataset. The x-axis represents the average number of fiducial markers and the y-axis represents the runtime (ms) in the log scale
