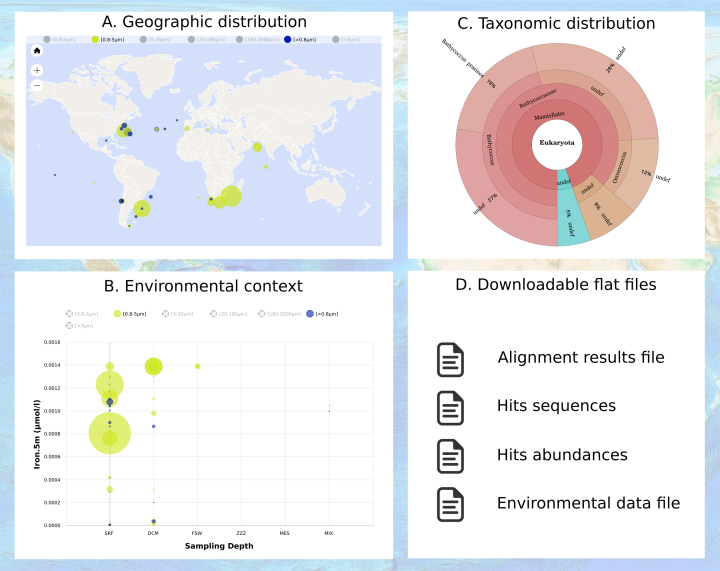
Figure 2.
The Ocean Gene Atlas interactive results panels. (A) Hits abundances are represented by the diameter of filled circle for each sample at user selected sampling depths (e.g. subsurface or mesopelagic). Circle colors represent the filter size fractions (e.g. [0.2–3 μm]). (B) Co-variation of hits abundances with specific environmental variables are shown on bubble plots for each sampling depths: subsurface (SRF), deep chlorophyll maximum (DCM) and mesopelagic (MES). (C) Taxonomic distribution of the hits genes's predicted origins are represented on interactive Krona plots. (D) Result files can be downloaded as tab delimited flat files.

