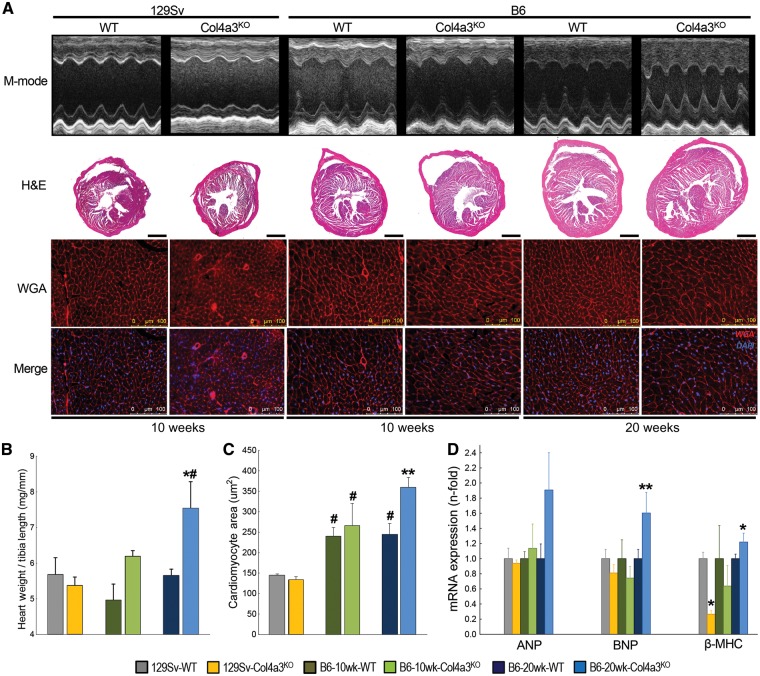
FIGURE 2.
Cardiac hypertrophy only develops in slow-progressing B6-Col4a3KO mice with advanced CKD. (A) M-mode echocardiography and representative cardiac midchamber histology in 10-week-old 129Sv, 10-week-old B6 and 20-week-old B6 WT and Col4a3KO mice. Bright-field microscopy: H&E (composite, scale bar = 1 mm) staining showing cardiac morphology; fluorescence microscopy: WGA and merged WGA and DAPI staining (merge, scale bar = 100 µm) showing cardiomyocyte size and number. (B) Heart weight:tibia length ratio. (C) Cardiomyocyte cross-sectional area calculated from WGA stained sections. (D) Cardiac mRNA expression of markers of hypertrophy (ANP, BNP and β-MHC). Values are mean ± standard error, n = 4–7 per group. P < 0.05 versus *WT, #all 129Sv and **all groups.

