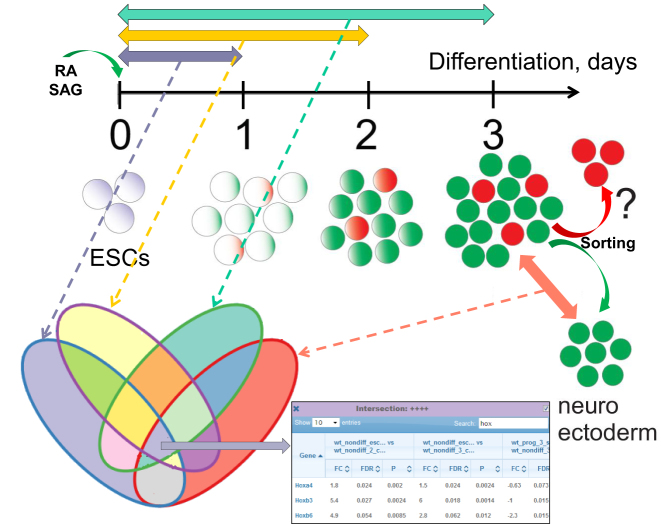
Figure 2.
Scheme of stem cell differentiation and analysis of differential gene expression. Mouse embryonic stem cells (mESCs) treated with retinoic acid (RA) and Shh agonist (SAG) were driven toward differentiation during at least three days. The cell transcriptomes of the days 1, 2, 3 were compared to that of the original mESCs. By day 3, neural progenitors emerged as a mixture population. From this mixture, neuroectodermal cells were derived by cell sorting and studied against the former. The four differential expression (DE) contrasts were selected and overlapped using the Venn diagram tool of evinet.org. As an example, genes DE in each of the four contrasts were chosen as the central intersection (table at the bottom) and forwarded to network enrichment analysis of evinet.org.

