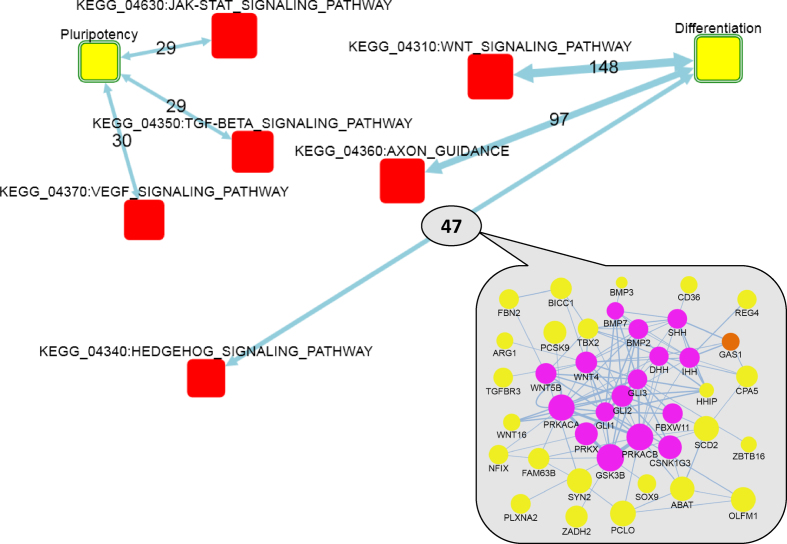
Figure 3.
Network enrichment of KEGG signaling pathways against gene sets that showed ongoing up- and down-regulation during differentiation toward neuroectodermal progenitor identity. Differentiation and Pluripotency: AGSs of 149 and 65 genes that were respectively up- and down-regulated at least 4-fold at each of the 1, 2 and 3 DDC compared to mESCs. Yellow boxes: AGSs. Red boxes: FGSs. Circles in the inset: member genes of AGS (yellow) and FGS (magenta) or both (orange). Node size: log(node degree) in the global network (cumulative for FGS and individual for genes). Two-headed arrows: summaries of individual gene–gene links (undirected or of arbitrary direction) from the global network that connected AGS and FGS. Edge labels: the number of individual gene–gene links behind each enrichment, where edge transparency corresponds to confidence of network enrichment score (maximal allowed NEA FDR = 0.05 corresponds to the highest transparency) and edge thickness stands for the number of gene–gene links. Links in the inset: thickness denotes edge confidence. For simplicity, FunCoup edges with Final Bayesian Score < 5 (29) are not shown.

