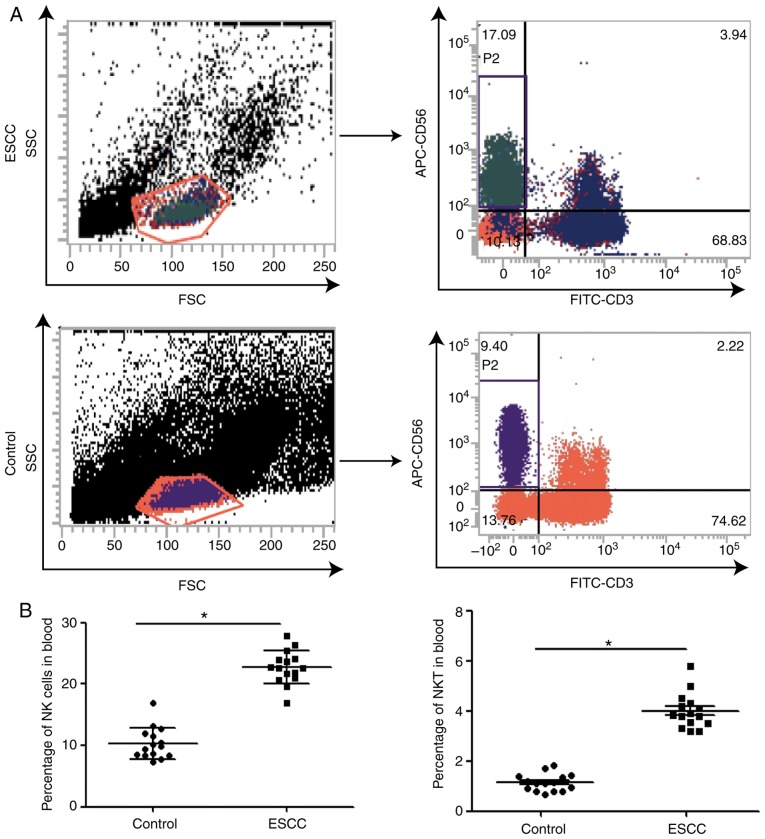
Figure 1.
Percentages of NK, NKT and T cells in the peripheral blood of patients with ESCC and control subjects, respectively. (A) Representative flow cytometry plots of NK, NKT and T cells, gated by CD3-CD56+, CD3+CD56+ or CD3+, respectively. (B) Percentages of NK and NKT cells in patients with ESCC and control subjects. *P<0.05. NK, natural killer; NKT, natural killer T; ESCC, esophageal squamous cell carcinoma; CD, cluster of differentiation; SSC, side-scattered light; FSC, forward scatter; APC, allophycocyanin; FITC, fluorescein isothiocyanate.

