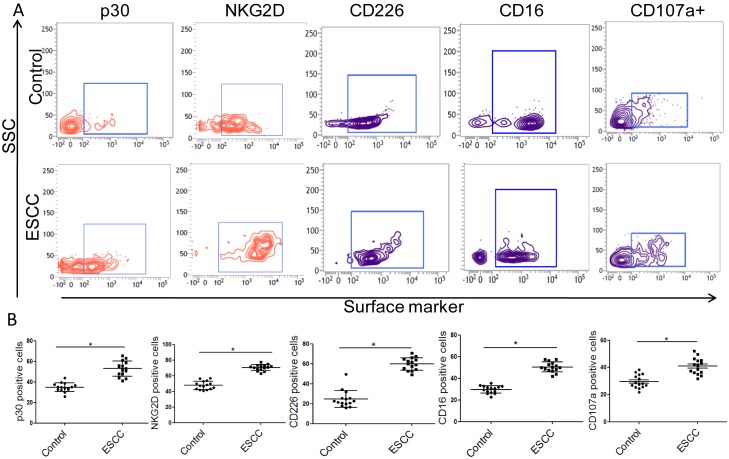
Figure 2.
Phenotype analysis of NK cells from the peripheral blood of patients with ESCC and control subjects. (A) Representative flow cytometry images and (B) quantitative analysis of the activating and inhibitory receptors of NK cells. *P<0.05. p30, NKG2D, CD226, CD16 and CD107a. NK, natural killer; ESCC, esophageal squamous cell carcinoma; NKG2D, NK group 2, member D; CD, cluster of differentiation; SSC, side-scattered light.

