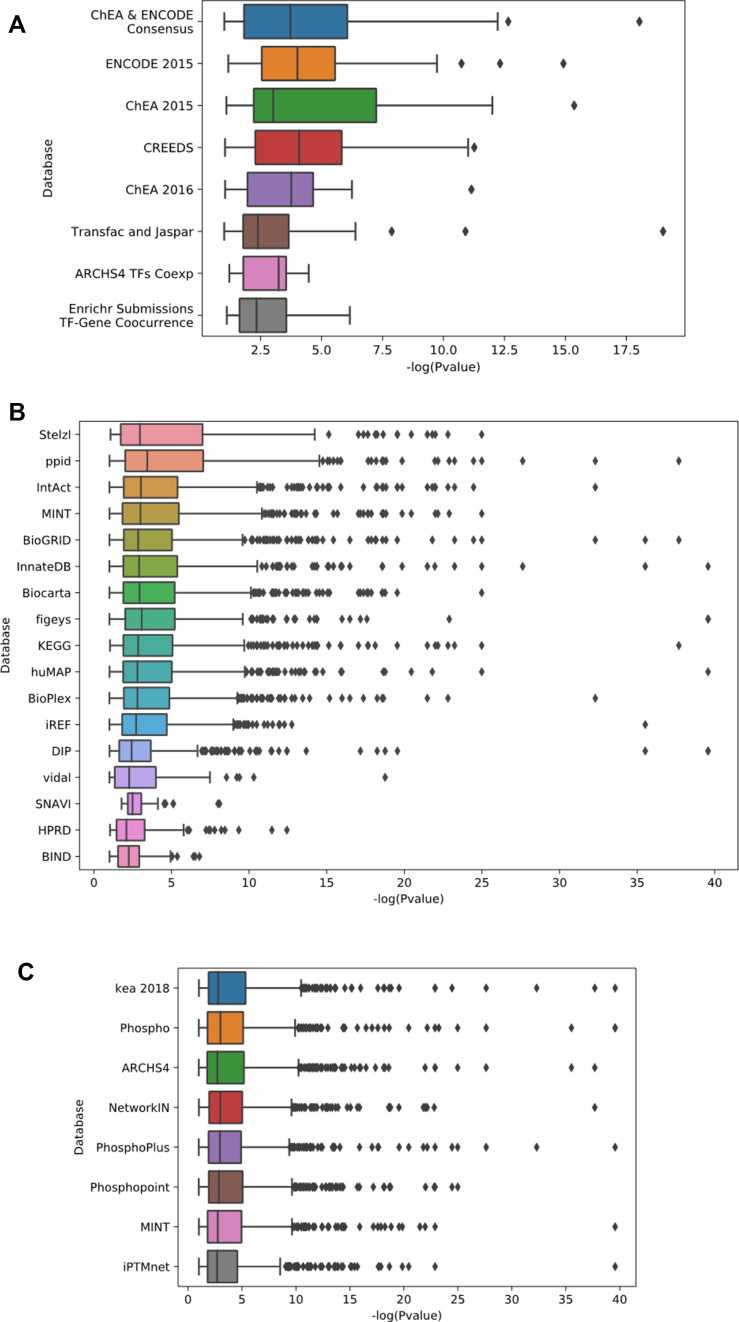
Figure 4.
Box plots to illustrate the contribution of each dataset option to the performance of the X2K pipeline in terms of fitness. The fitness is determined by the negative log of the P-value of the ‘correct’ kinase. (A) Transcription factor libraries; (B) Protein interaction networks; (C) Kinase–substrate libraries.

