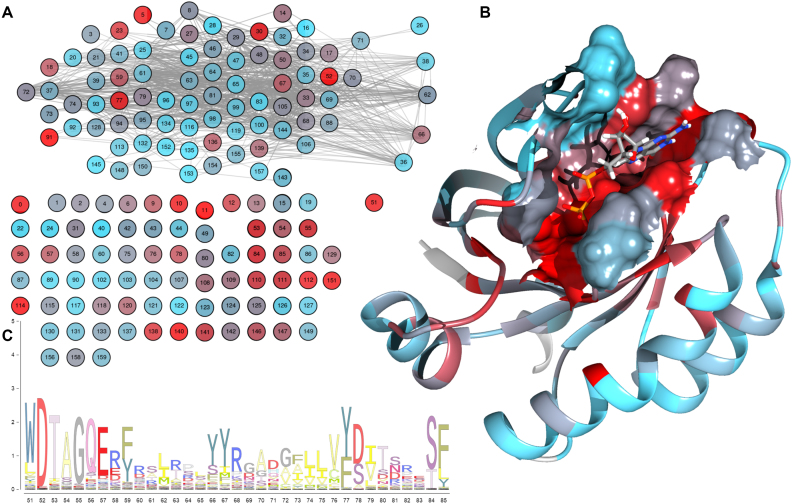
Figure 3.
(A) MIp covariation network with nodes colored by conservation, from light blue (lower) to red (higher). (B) Ribbon representation of the overall structure (PDB 4LPK_B) with surface representation of the GDP/GTP interaction site, colored as in the network. It is worth noting the high conservation in the binding site. (C) A section of the sequence logo which translates to the network conservation coloring schema.

