Figure 5.
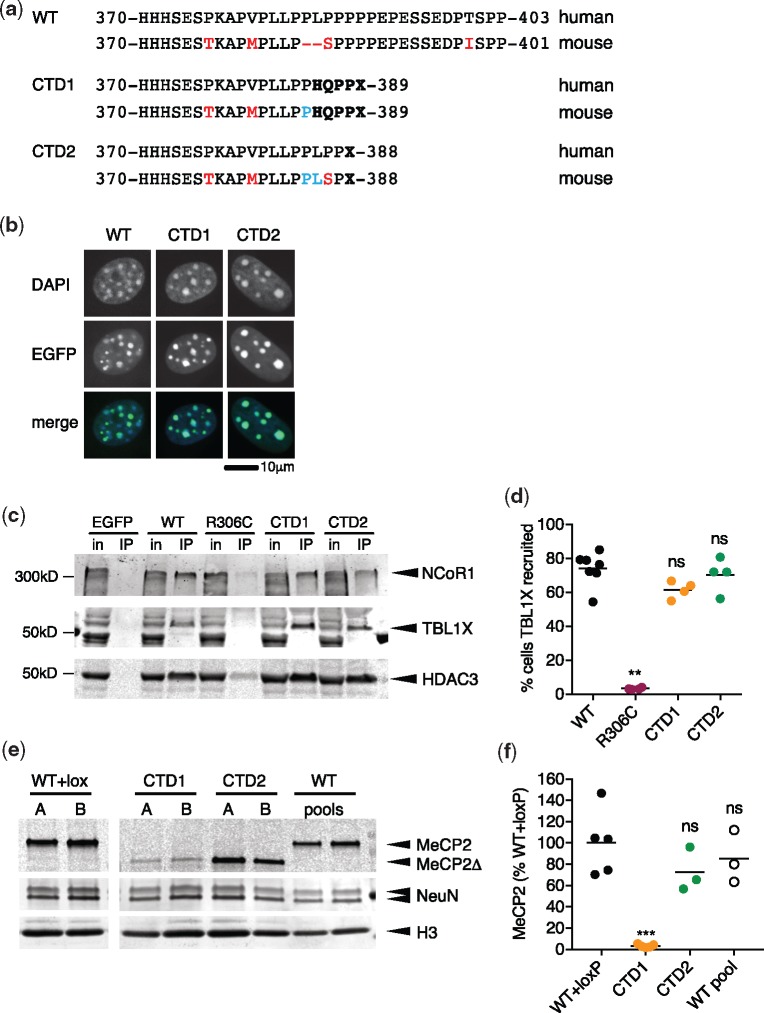
C-terminal truncation mutants CTD1 and CTD2 show normal NCoR/SMRT recruitment but differ in neuronal protein levels. (a) Comparison of the human and mouse MeCP2 CTD regions for wild-type (WT) and the patient mutations CTD1 and CTD2. Amino acid changes and absent amino acids in the mouse protein are shown in red, amino acids added to mouse CTD1 and CTD2 proteins in blue and missense/nonsense changes arising due to deletion/frameshift in bold type. (b) WT, CTD1 and CTD2 EGFP-MeCP2 fusions expressed in mouse NIH-3T3 cells. (c) Immunoprecipitation of EGFP-MeCP2 from transfected HEK 293 cells with GFP-Trap beads. NCoR/SMRT components NCoR1, TBL1X and HDAC3 detected in western blots of input and immunoprecipitated samples. (d) Quantification of TBL1X recruitment efficiency of MeCP2 mutants. Percent of doubly transfected nuclei with TBL1X-mCherry/EGFP-MeCP2 spots in each independent transfection shown as mean (black line) and individual values. WT n=7, R306C, CTD1, CTD2 n=4 independent transfections. Genotypes were compared to WT using a two-tailed Mann–Whitney test. R306C P=0.0061 (**), CTD1 P=0.0727 (ns), CTD2 P=0.6485 (ns). (e) Representative western blot showing levels of MeCP2 protein present in neurons on day 15 of differentiation (7 days after plating). Lanes A and B for each genotype are derived from independently targeted ES cell clones and WT pools are independent differentiations of the parental ES cell line. An antibody against the N-terminus of MeCP2 detects both full-length and truncated (Δ) protein. (f) Quantification of MeCP2 levels in in vitro differentiated neurons. Two independent clones were differentiated 2 or 3 times for each genotype. MeCP2 level (MeCP2 signal/H3 signal) is normalized to the mean WT + loxP value. Data shown are mean (black line) and five (WT+loxP, CTD1) or three (CTD2, WT pools) independent differentiations. Comparison to WT+loxP (two-tailed unpaired t-test with Welch’s correction for unequal variances): CTD1 P=0.0021 (***), CTD2 P=0.1874 (ns) and WT (pool) P=0.4868 (ns).

