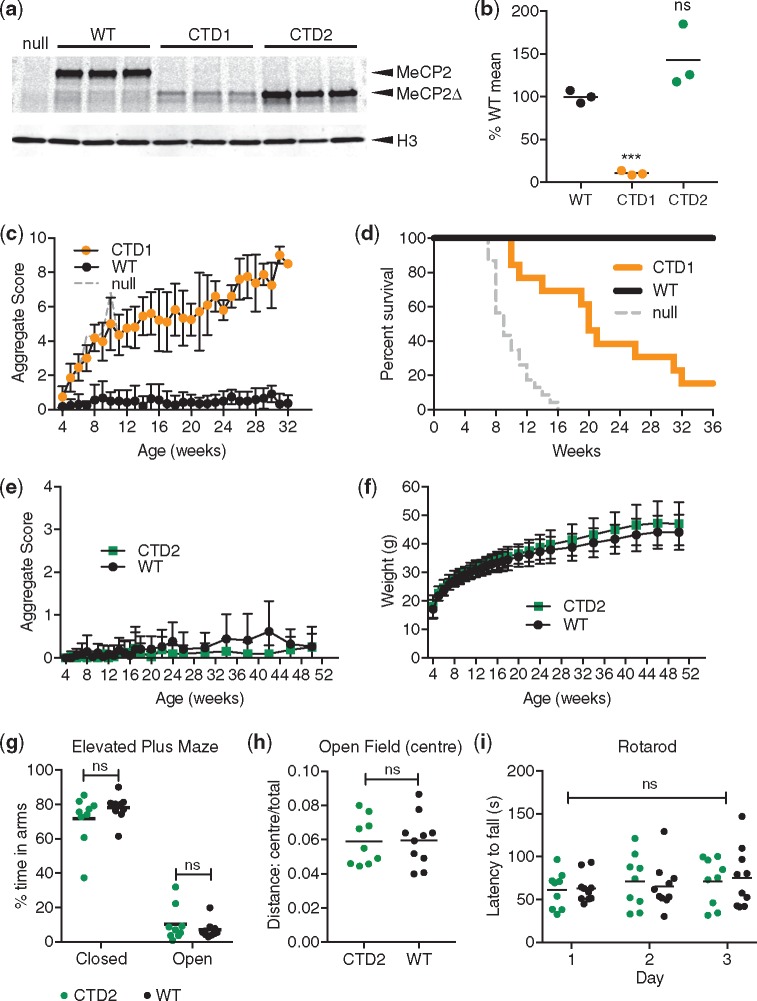
Figure 6.
CTD1 and CTD2 mice show contrasting phenotypes due to different levels of MeCP2 in brain. (a) Western blot of whole brain lysates from 6-week-old CTD1, CTD2 and WT males. A Mecp2-null sample is shown for comparison. CTD1 and CTD2 mice express a truncated protein, MeCP2Δ. (b) Quantification of (a): the level of MeCP2 (MeCP2 signal/H3 signal) as a percentage of mean WT shown as mean (black line) and individual values for each genotype (n=3 animals). Comparison to WT (two-tailed unpaired t-test with Welch’s correction for unequal variances): CTD1 P=0.0008 (***) and CTD2 P= 0.1773 (ns). (c) CTD1 hemizygous males display RTT-like phenotypes. Mean aggregate phenotypic score±SD plotted for mutants and WT male littermates, CTD1 n=11, WT n=7 (at 4 weeks). (d) Kaplan–Meier survival plot for CTD1 hemizygous males and WT littermates shown in (c). (e) Phenotypic scoring of CTD2 males and WT littermates. Mean aggregate phenotypic score±SD plotted for mutants and WT male littermates, CTD2 n=16, WT n=17. (f) Mean weight±SD for animals shown in (e). (g) Elevated plus maze. Percentage of time spent in the closed and open arms is shown as mean (black line) and individual values. Percentage time in open and closed arms for each genotype was compared using two-tailed unpaired t-tests: closed arms P=0.2238 (ns), open arms P=0.3713 (ns). (h) The ratio of distance travelled in the central zone of the open field arena to total distance travelled shown as mean (black line) and individual values. Two-tailed unpaired t-test test P=0.9394 (ns). (i) Accelerating rotarod test. The latency to fall is shown as mean (black line) and individual data points on each day. Two-way ANOVA (repeated measures) [genotype effect, F(1, 17)=9.451×10⁻⁶, P= 0.9976 (ns)]. (g)–(i) CTD2 n=9, WT n=10.

