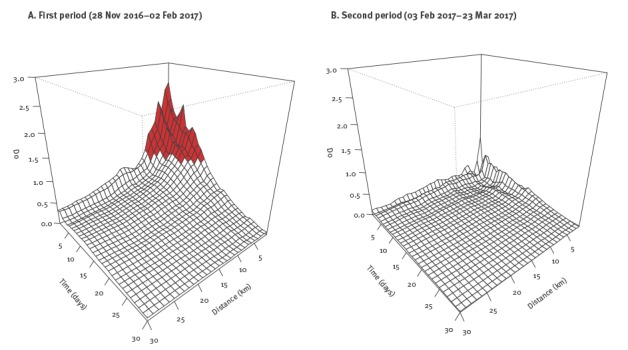
Figure 3.
Excess risk attributable to space–time interaction (D0) as a function of space (in km) and time (in days) during two periods of the HPAI-H5N8 epidemic, 28 November 2016–23 March 2017
HPAI: highly pathogenic avian influenza.
The red-shaded area shows the space–time combinations for which the observed number of events was higher than twice the expected number (D0 > 1).

